

What is ARPU? Average Revenue Per User (ARPU) is is the amount of revenue each of your active users (on average) contributes — and an essential metric for growth marketers who aiming at mobile app monetization. In this post, you’ll learn how to calculate ARPU, what questions to ask to help move the move the needle on this important app metric.
Some app analytics matter more than others — especially to subscription or revenue-driven apps. For these apps, one metric, Average Revenue Per User (ARPU) is especially critical, as it tells you whether you’re meeting your overall goal for the app: monetization.
How to Caluculate Average Revenue Per User (ARPU)
Average Revenue Per User (ARPU) is the amount of revenue each of your active users (on average) contributes. Here’s the ARPU formula:
ARPU = Total Revenue Generated During a Specific Timeframe / Total Number of Active Users During a Specific Timeframe
Let’s say that the timeframe is one month. Monthly active users would include anyone active within the selected month period. So to determine revenue, you’d look at:
Monthly Active Users X Monthly Average Revenue Per User = Revenue
What makes some app users stick around, and others churn? Would it surprise you to learn push notifications can play a huge role? Get the bencharks in our data study: How Push Notifications Impact Mobile App Retention Rates. Download your free copy today.
How to Increase ARPU
The two key app analytics to watch — and levers to use to increase ARPU — are
- Number of app installs
- Number of monthly active users
By assessing each of the app analytics contributing to ARPU, you can start to identify where to improve.
An important related metric is your average cost per install (CPI). If possible, it’s great to get even more granular CPI information, like CPI for loyal users; CPI for users who tend to churn, CPI for users who have made a purchase, and other user segments important to your business.
From there, ask yourself:
Do I have a lot of app installs, but low app retention?
- What is my hypothesis about why users leave, and what experiments could I run to test it?
- Am I attracting the wrong audience?
- Am I lacking a retention strategy or reason for the user to return?
- Am I connecting with app users through push notifications within the first 90 days?
- Have you set up a welcome series?
- Are you using predictive churn analytics to try to keep users before they’re gone?
Do I have a small number of installs, but high retention?
- What do my user-level analytics tell me about what attributes my retained users share?
- Do my monthly active users generate more revenue than the cost to acquire them? The attributes of your “best user” cohorts can be used for lookalike campaigns or referral programs. This can decrease cost of acquisition through designing more targeted and more effective campaigns.
- Am I maximizing in-app marketing channels with in app messaging and a message center —and encouraging your users to share the app?
Do my retained users spend any money?
- Subscription, in-app advertising, affiliate marketing, and in-app purchase models benefit from retaining app users over time.
- What experiences can be tweaked or reimagined to improve mobile app monetization efforts and increase spend?
How to Calculate ARPU Metrics in Urban Airship Insight
The industry-specific dashboards and app analytics tools in Urban Airship Insight make it simple to get a high level view of ARPU — as well as the average revenue for a specific conversion event.
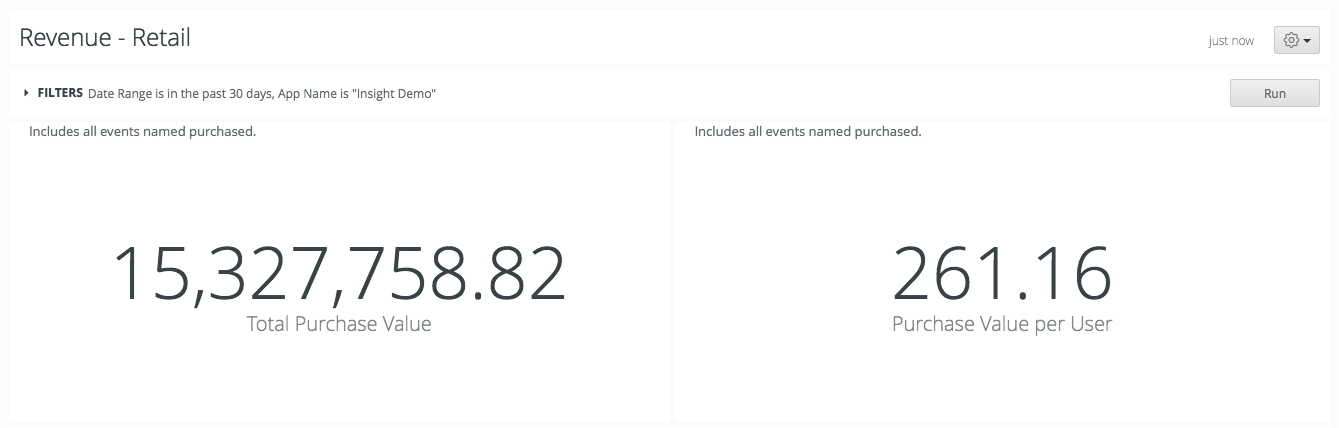
For example, Our Revenue Dashboard within the Insight UI shows the total purchase value for the last 30 days was $15,327,758.82 and the average purchase value for all users that purchased was $261.16.
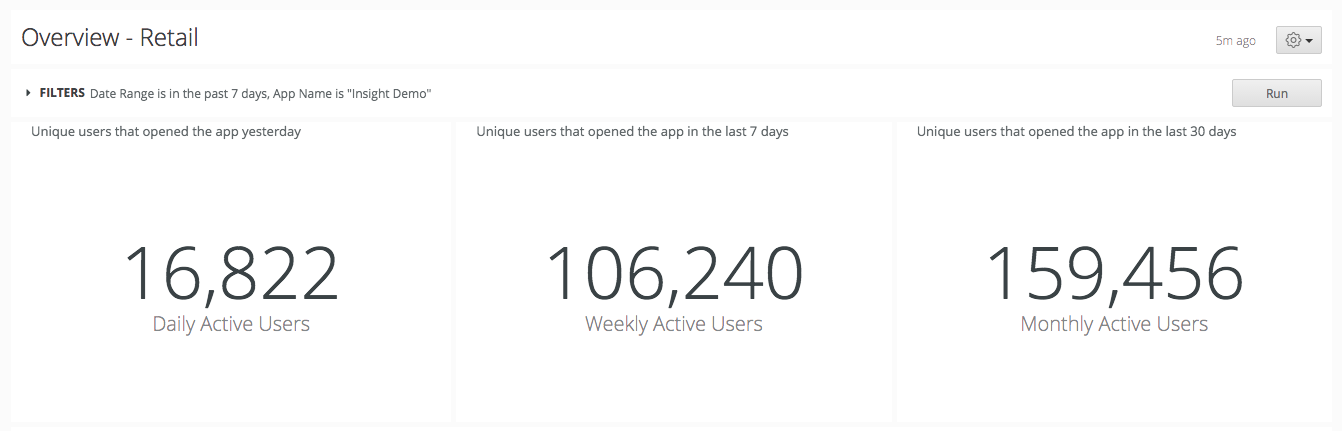
The Overview Dashboard showed we have 159,456 monthly active users (MAU).
Based on the formula, the ARPU = Total Revenue / MAU = $15,327,758.82 / 159,45 = $96.13.
Pulling this all together, we can see that:
- The average transaction value is $261.16, and
- Taking into account all monthly active users, the average revenue generated was $96.13 per monthly active user.
It’s important to measure both the average transaction and ARPU, as the average transaction value gives you a sense of how much users that complete the purchase funnel spend. The ARPU gives you a sense of how many of all your monthly active users end up spending in the app.
Measuring both helps you associate the value of growing your monthly active users while also maintaining a high conversion value.
In Conclusion
ARPU is a springboard to calculating the return on investment for your marketing efforts, so make sure you’ve got an easy way to keep a close watch on it — and let it drive action and experimentation to make sure you’re on track.
![The best retail customer engagement platforms for no-code growth teams [2026]](https://www.airship.com/wp-content/uploads/2026/06/The-best-retail-customer-engagement-platforms-for-no-code-growth-teams-2026-404x211.png)
![Retail customer engagement: The ultimate guide to growing your business in 2026 [5 real examples]](https://www.airship.com/wp-content/uploads/2026/06/Retail-customer-engagement-The-ultimate-guide-to-growing-your-business-in-2026-5-real-examples-404x211.png)