

Get a peek at the inner workings of our Predictive Churn solution from the data scientist who made it a reality, our own Lisa Orr. (This content originally appeared in Inside Big Data, and is reprinted here with permission.)
With the cost of acquiring new app installs skyrocketing, keeping users engaged who have already installed is critical for maximizing acquisition spend and customer lifetime value. Urban Airship’s Data Science team has spent the last year developing a way to identify and target users who are likely to stop using your app. We are calling this Predictive Churn.
Here, I provide insight into the process of building a scalable predictive machine learning model over billions of events and address how these predictive capabilities lead to new insights into user behavior, fuel new engagement strategies and impact user retention.
Churn Prediction: Developing the Machine Learning Model
Churn prediction is a straightforward classification problem: go back in time, look at user activity, check to see who remains active after some time point, then come up with a model that separates users who remain active from those who do not. With tons of data, what are the best indicators of a user’s likelihood to keep opening an app?
For starters, we can look at a user’s general app activity. How often does the individual open the app? How recently have they opened it? If we are trying to predict who will be opening in the near future, a good indicator might be whether a user is already opening the app or not. What about the impact of receiving push notifications? Does choosing to receive them in the first place impact user app activity?
Looking back 60 days into customers’ data, we rolled up message sends and app opens into graduated windows with additional information such as device platform and app id. We then labeled each user as having churned or not churned based on whether they open the app in the next 30 days.
>> Related Benchmark Report: How Push Notifications Impact Mobile App Retention Rates
With the feature data rolled up for each user, we trained a model using the gradient boosted decision trees machine learning algorithm. We performed a six month historical study of churn prediction training the model over dozens of features (i.e. the observable user and app behaviors). Our goal was to get a high level of accuracy in predicting churn — as well as insight into what factors influence it.
Looking into the model and which features had the biggest impact, we found some interesting patterns:
Open activity. By far the biggest predictor of future activity was how long it had been since their most recent open. Which makes sense as it’s the thing we’re trying to predict just in the opposite direction with regard to time. Open counts within recent time windows and recency of opens both play a large part in predicting who is going to churn.
Send activity. Another interesting finding was that receiving push notifications had a positive impact on user retention. This again makes sense — if you choose to opt in to push notifications then you’re signaling an active interest in the app and an openness to discovering more of its value.
A recent data study from Urban Airship’s data science and marketing teams illustrates this point. Users who received at least one push notification had a 66 percent higher retention rate as compared to users who received no push messages.
We also found a correlation between number of sends received and days retained where the more messages a user received the longer they continued using the app. As with open counts, both the recency and frequency of sends played a role in modeling churn activity.
Scaling the Model for Mobile
Now that we created a working model, the next step was to test its ability to scale to thousands of apps and billions of users.
Adding more apps quickly exposed a weak spot: the re-processing of data from a csv (the output from a MapReduce job to create our feature data) to a sparse matrix (format required by the boosted trees model). This processing step was causing the job to fail due to memory issues. Adding compute resources would solve the issue temporarily, but as we added more apps it became clear we needed to rethink our strategy. Writing to a csv was useful during the development phase so we could double check our work. But besides being human-readable, there was no real benefit for using the intermediary format.
We instead re-formatted the feature data into sparse matrices directly within the MapReduce job itself. So far further memory pressure has been solved by adding more machines in the MapReduce phase or by upping the size of the single machine used during the modeling phase. With the formatting change in place, we are able to train our model over thousands of apps simultaneously.
Productizing the Model
Once we had a working model at scale, the next step was figuring out how to best provide these predictions to our customers. For each user we feed into our model we get back a probability to churn score ranging from zero to one. The higher the score, the more confident we are that that a user will churn. Likewise the lower the score, the more confident we are that that user will stick around.
If you look at the outer edges of churn probability, you’ll find your app’s super fans (those who are definitely coming back) and your app’s more difficult patrons. And in the middle resides a mixed bag of individuals where the model is less confident about which way they will go.
This conception of the model led us to segmenting users into three groups: high-risk, medium-risk, and low-risk groups. Sending up predictions this way gives our customers the ability to adjust their audience segmentation by how aggressive their engagement strategy is.
For example, if you’re attempting to re-engage at-risk users you can scale up the reward offered if you include only the high-risk audience or scale it down if you include both the high-risk and medium-risk audience.
Once a user has been categorized as high, medium or low risk-to-churn, the data is immediately available through our real-time mobile data stream for analysis or action in other systems, dashboards to view five-week performance, and visualizations to show how effective your efforts are in moving users from high-risk to lower risk states.
Churn Prediction in the Wild
To illustrate the how Predictive Churn can influence engagement strategy (and vice versa) here are a few anonymized Urban Airship customers and their respective churn score distributions:
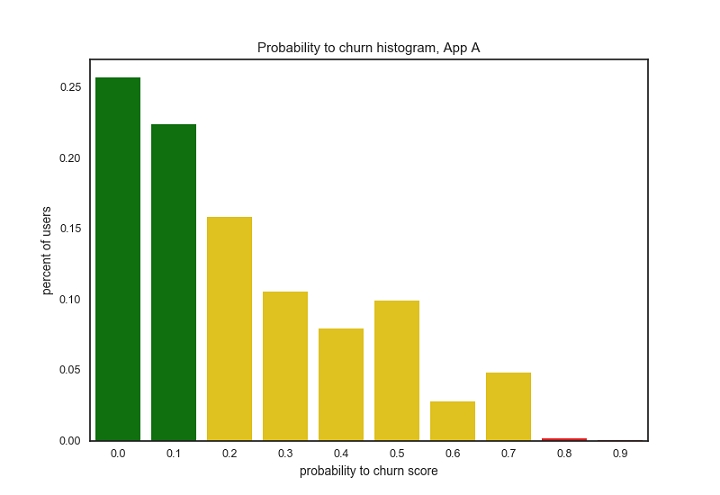
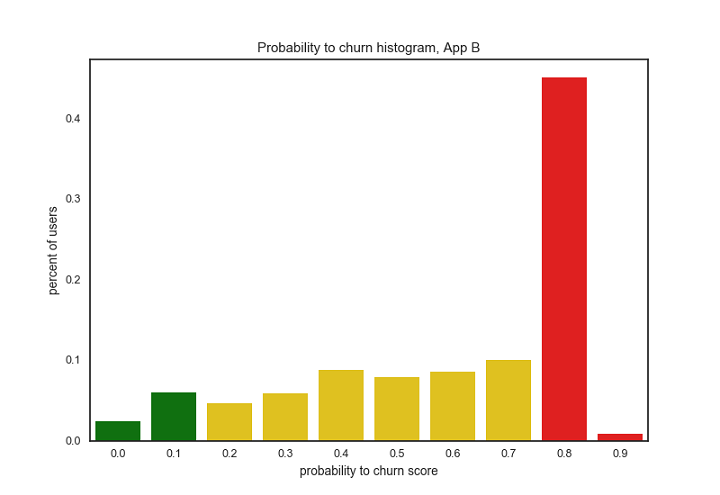

Above visualizations: Histograms of user churn prediction scores for three example Urban Airship apps. Each bar represents the percentage of users whose probability to churn score fell within the specified score range. Colors represent risk category: green is low-risk, yellow is medium-risk, red is high-risk. Predictions were made on February 3rd, 2017.
Comparing the three apps represented by the histograms above, we can see very different user distributions for churn prediction:
For App A most users are in the low-risk group
For App B most users are in the high-risk group
For App C we see a bimodal distribution where a large group of users are in the high-risk group and another large group of users are in the low-risk group
How does churn prediction relate to app engagement strategy? All three of these apps have large audiences (greater than 3 million unique devices) and all three use push messaging to engage their users. However, there is a large difference in how these apps approach engagement.
- App A (low-risk app) has a very sophisticated engagement strategy, using advanced features extensively (i.e. tags, lifecycle lists, in-app notification, message center etc.), are targeting most of their audience with segmented pushes, and are getting high levels of engagement with those messages (through direct or influenced app opens).
- App B (high-risk app) is using a very basic messaging strategy with very simple segmentation, is messaging infrequently to a limited segment of their audience, and is gaining almost zero audience engagement.
- App C (the app with a bimodal distribution for churn scores) has a middle-ground strategy. They are utilizing a few advanced engagement features such as aliases, badges and deep links, are sending almost exclusively broadcast (non-personalized) messages, and are seeing a good amount of audience engagement with those messages.
By comparing churn prediction and app engagement strategy our customers can identify areas for improvement, effect those changes and compare how churn scores change week over week.
For App B, we would recommend targeting more of their audience, messaging more frequently and expanding their use of messaging strategy to alternative communication such as in-app messaging and message center as well as improve targeting via tags and named user.
For App C, we would suggest moving away from broadcast pushes as well as targeting the high-risk audience explicitly.
What’s Next
Predictive churn enables companies to reach customers at the right time on the right channel and with the right content to turn them from a customer than churns to one that stays. But this is just the start of data science and machine learning capabilities. Not long from now, it will be standard for companies to use data to send automated and proactive notifications and improve customer engagement.
Download our benchmark report How Push Notifications Impact Mobile App Retention Rates today to:
– Get industry-specific data on push notification send frequency
– Build a smarter push notification strategy
– Maximize your user acquisition spend & push notification ROIGet your copy >>

![The best retail customer engagement platforms for no-code growth teams [2026]](https://www.airship.com/wp-content/uploads/2026/06/The-best-retail-customer-engagement-platforms-for-no-code-growth-teams-2026-404x211.png)
![Retail customer engagement: The ultimate guide to growing your business in 2026 [5 real examples]](https://www.airship.com/wp-content/uploads/2026/06/Retail-customer-engagement-The-ultimate-guide-to-growing-your-business-in-2026-5-real-examples-404x211.png)