


Introduction
Your brand at the center of their world
Did your mobile growth strategy survive the pressures of 2025?
This past year, mobile strategies were put to the ultimate test. The year started off with a U.S. presidential transition that triggered hundreds of thousands of breaking news and live-stream alerts. As global conflicts and social unrest escalated, headlines moved at an often unforgiving pace, and consumers instinctively reached for their phones for critical updates.
In the sports world, two major events kicked off. Super Bowl LIX saw the Philadelphia Eagles defeat the Kansas City Chiefs, drawing over 127 million viewers who simultaneously engaged with score updates, betting platforms, and food delivery apps. By summer, the expanded FIFA Club World Cup generated a month-long event surge in sports app engagement, creating highly localized traffic spikes whenever regional teams took the pitch.
When seconds mattered most, the year’s devastating weather events — including the Texas Central Flooding and Hurricane Melissa — pressure-tested the mission-critical reliability of mobile infrastructure. Millions of users turned to networks for answers, relying on apps as lifelines for emergency updates, travel rebooking, and service disruptions.
As the year closed, a late Thanksgiving compressed the holiday shopping season into a frantic 28-day window. Retailers responded with a high-volume blitz of scarcity messaging, flash sales, and cart abandonment alerts. This precision targeting fueled a record-breaking weekend, culminating in Cyber Monday hitting $14.25 billion in online sales — the largest single online shopping day in U.S. history, moving at a staggering $16 million every minute.
Every one of these events created moments for brands to engage, inform, and guide consumers in real time on the remote control of their daily lives — their smartphones. To orchestrate these moments, brands rely on push notifications more than any other channel. In 2025 alone, top global brands using Airship sent over 681 billion push notifications to more than 3 billion users.
But the brands truly mastering mobile aren’t only sending message blasts. They’re intelligently orchestrating cross-channel journeys. They’re deploying market-leading AI to send notifications at the exact moments that matter. They’re driving users to their app with customized experiences that drive conversions and real results.
To ensure your brand is keeping pace, you need to measure your performance against proven standards. Inside our 2026 Benchmarks Report, we’ve analyzed those 681 billion interactions across 15 verticals to answer your most pressing questions:
- What’s the average opt-in rate for my industry?
- How do opt-in and open rates compare between Android and iOS?
- What is the baseline push volume for my competitors?
- Are my open rates lagging, baseline, or leading the pack?
Of course, data without direction is just noise. Alongside the benchmarks, we’ve included practical, outcome-obsessed strategies you can deploy immediately. You’ll learn best practices from the forefront of mobile innovation, showing you exactly how top brands unlock the full power of push to outperform their peers.
Welcome to the mobile way to grow.
The 15 industry verticals we analyzed
We broke each benchmark metric down by key industry verticals. Below, you’ll find definitions for each vertical to help you identify the most relevant categorization for your brand.
- Business: Apps driving professional engagement, B2B services, and corporate operational efficiency.
- Charities, foundations, and non-profits: Mobilizing supporters and driving vital donations through mission-critical, community-focused outreach.
- Education: Empowering students and educators with real-time learning updates, deadline reminders, and campus alerts.
- Entertainment: Captivating audiences with personalized content discovery, new release drops, and live event ticketing.
- Finance and insurance: Building consumer trust through secure, zero-latency transactional alerts and personalized account guidance.
- Food and drink: Satisfying cravings and driving foot traffic with hyper-local promotions, loyalty rewards, and live order tracking.
- Gambling and gaming: Keeping players locked in and engaged with high-stakes updates, live odds, and instant in-game rewards.
- Government: Delivering essential public services, civic updates, and critical, localized emergency alerts.
- Media: Breaking the news and capturing attention in a relentless, fast-paced global headline cycle.
- Medical, health, and fitness: Guiding users toward their wellness goals with secure appointment reminders and daily habit-tracking nudges.
- Retail: Turning window shoppers into loyal buyers through highly targeted flash sales, restock alerts, and cart abandonment messaging.
- Social: Connecting communities and driving constant peer-to-peer engagement through instant interaction updates.
- Sports and recreation: Fueling fanaticism with real-time score updates, breaking trades, and seamless game-day logistics.
- Travel and transportation: Smoothing the passenger journey with mission-critical itinerary changes, gate updates, and immediate rebooking alerts.
- Utility and productivity: Streamlining daily life with highly functional reminders, account management alerts, and core service updates.
How to read the data
This data is designed to help you benchmark three critical engagement metrics: opt-in rates, direct open rates, and the average monthly push notifications per user.
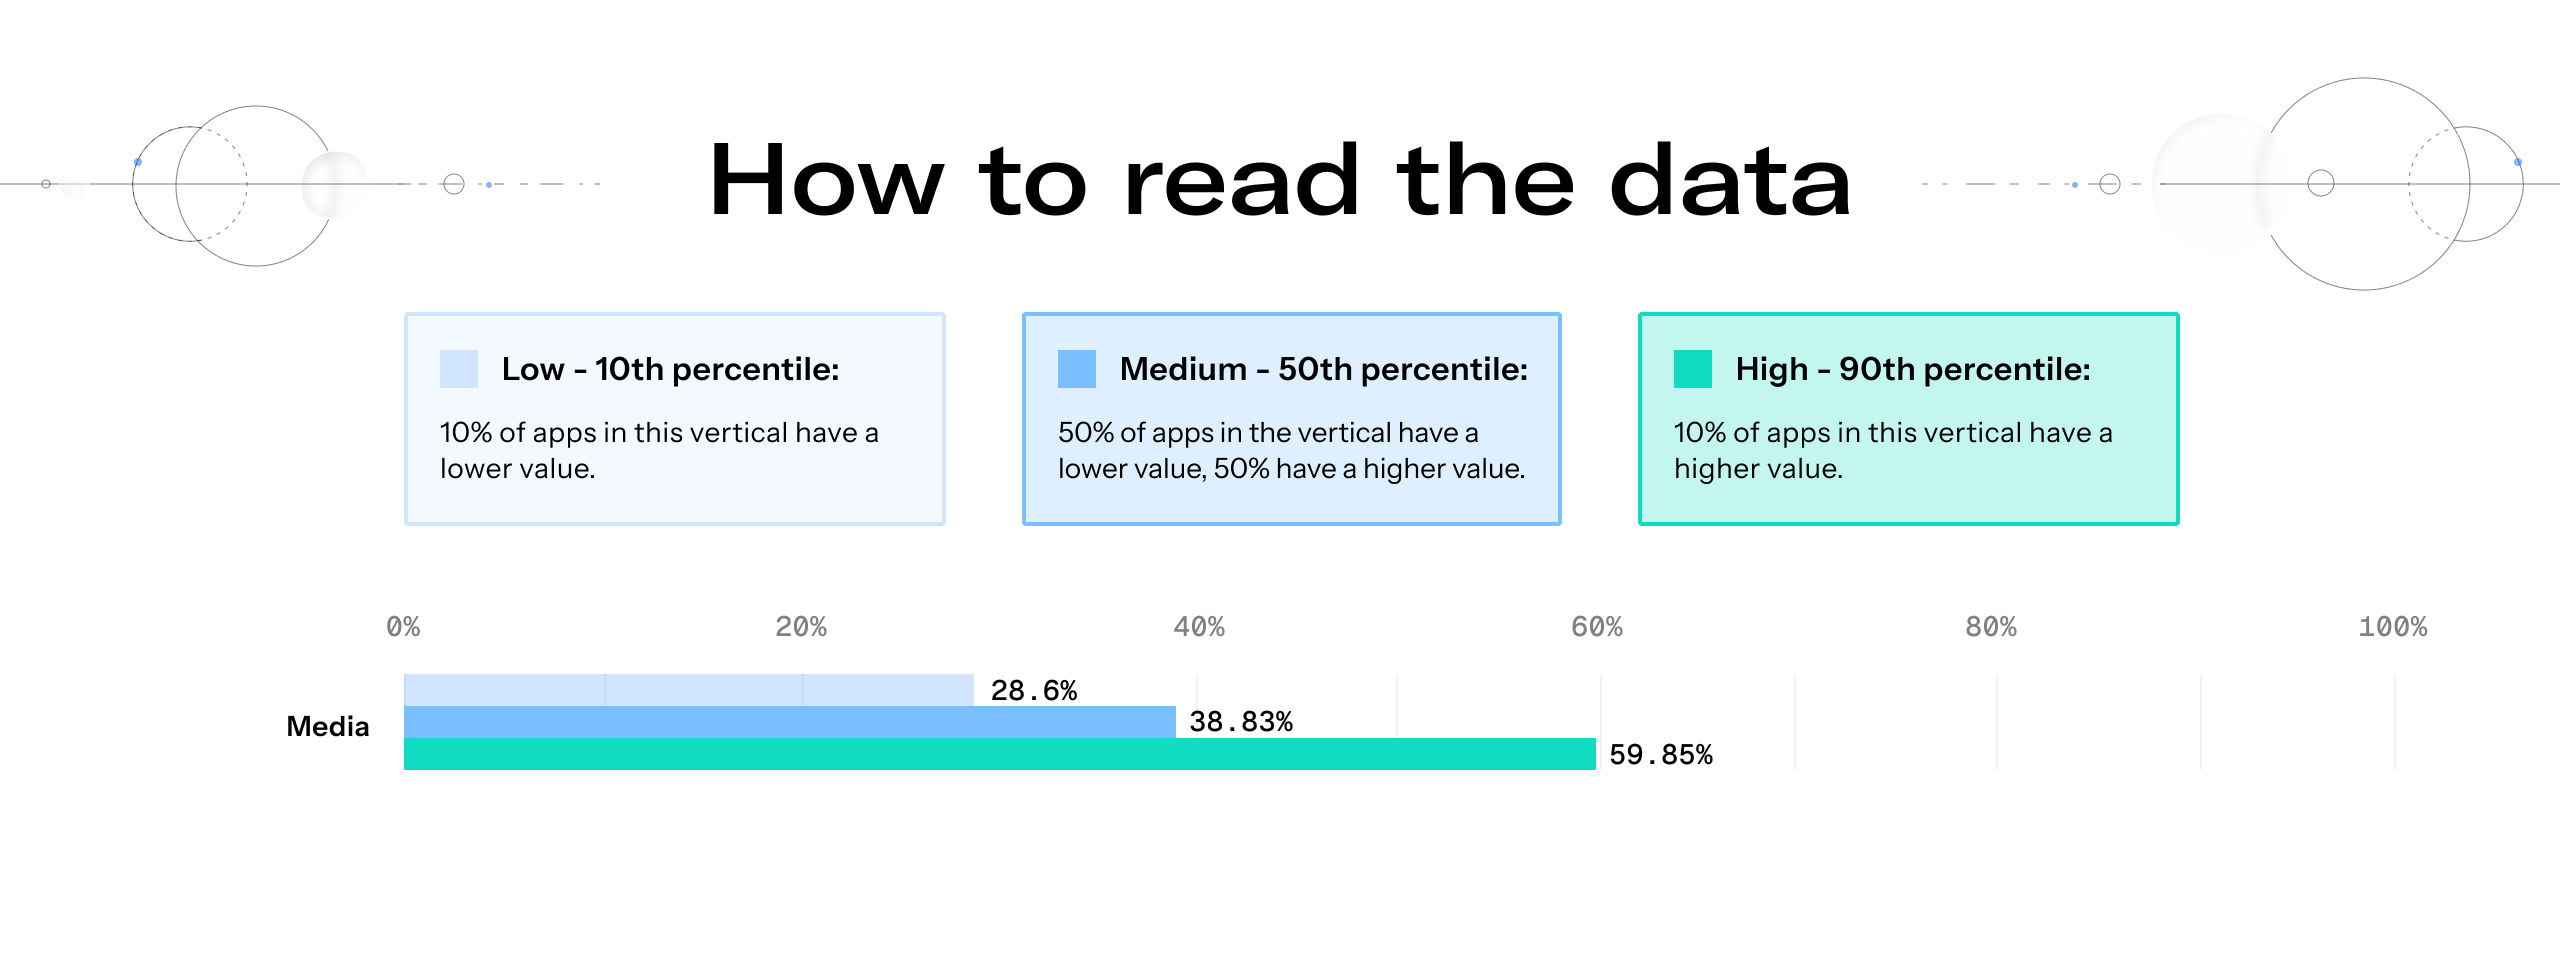
To give you a clear picture of the competitive landscape, we’ve broken the data down into three percentiles:
- High (90th percentile): The top tier. Only 10% of apps in your vertical achieved a higher value.
- Medium (50th percentile): The median. Treat this as the standard baseline for your vertical.
- Low (10th percentile): The bottom tier. Only 10% of apps saw a lower value.
If your rates rank at or above the 90th percentile, your mobile growth strategies are industry leading — you are successfully orchestrating experiences that resonate and convert. Conversely, if your rates fall below the 10th percentile, you are in the bottom 10% of your vertical. View this not as a setback, but as a clear signal that there is significant room to optimize your personalization, timing, and overall mobile strategy.
Push notification opt-in rates
What are push notification opt-in rates?
The percentage of an app’s audience that has granted permission — opted in — to receive push notifications. In this report, we measured it as a monthly average over 12 months.
Why do push notification opt-in rates matter?
Push notifications are one of the most effective ways to deliver glanceable value, re-engage customers, and intelligently guide them back into your app. With user retention standing as a universal challenge across all categories, securing opt-in permissions early is critical for long-term growth. High-performing apps routinely see activation spikes within the first 30 days after download — largely driven by timely, orchestrated push notifications.
When users opt in, basic engagement transforms into measurable business impact. Here is how securing that permission directly influences your bottom line:
Drives immediate revenue and conversions
Airship research has found that opted-in customers consistently outperform opted-out users at the point of purchase.
- Entertainment: Opted-in customers purchase 10% more frequently.
- Health and beauty: Devices opted-in to push show a 7% lift in purchase events.
- Hospitality: Opted-in customers book 4% more frequently.
Accelerates engagement and high-value actions
Beyond retail, Airship research also shows opt-ins act as a powerful retention multiplier and engagement driver across all industries.
- Retention multipliers: A leading airline found that opted-in users have a 2.9x higher Day 30 Activation Rate than those who remain opted-out.
- High-value behaviors: Opted-in customers complete core, non-retail actions far more often. For instance, a food rescue app found opted-in users are 2.5x more likely to list an item in the app.
- Session lifts: Users who opt-in consistently generate a higher number of overall app sessions, which is especially valuable for ad-revenue monetization models.
Reduces Customer Acquisition Costs (CAC)
Customer acquisition costs have jumped 60% over the last five years. Securing an opt-in allows brands to prioritize communication through owned channels rather than expensive paid media, directly reducing the cost of re-engaging and retaining that customer.
Android vs. iOS
Historically, Android opt-in rates artificially inflated performance metrics because notifications were enabled by default, whereas iOS has always required explicit consent. Today, with the universal adoption of Android 13+, that gap has permanently closed, bringing Android and iOS opt-in rates to near parity.
For brands, this means the era of the passive “default opt-in” is officially over. Across all operating systems, teams must actively earn a customer’s permission. Success now requires mastering the value exchange — clearly communicating the tangible benefits of your mobile experience and intelligently timing your permission prompts to match high-intent moments in the customer journey.
Three takeaways for push notifications opt-in rates
1. Utility and trust command the highest opt-ins
Across both Android and iOS, high-achieving verticals have one thing in common: they provide undeniable functional value or operate on deep consumer trust.
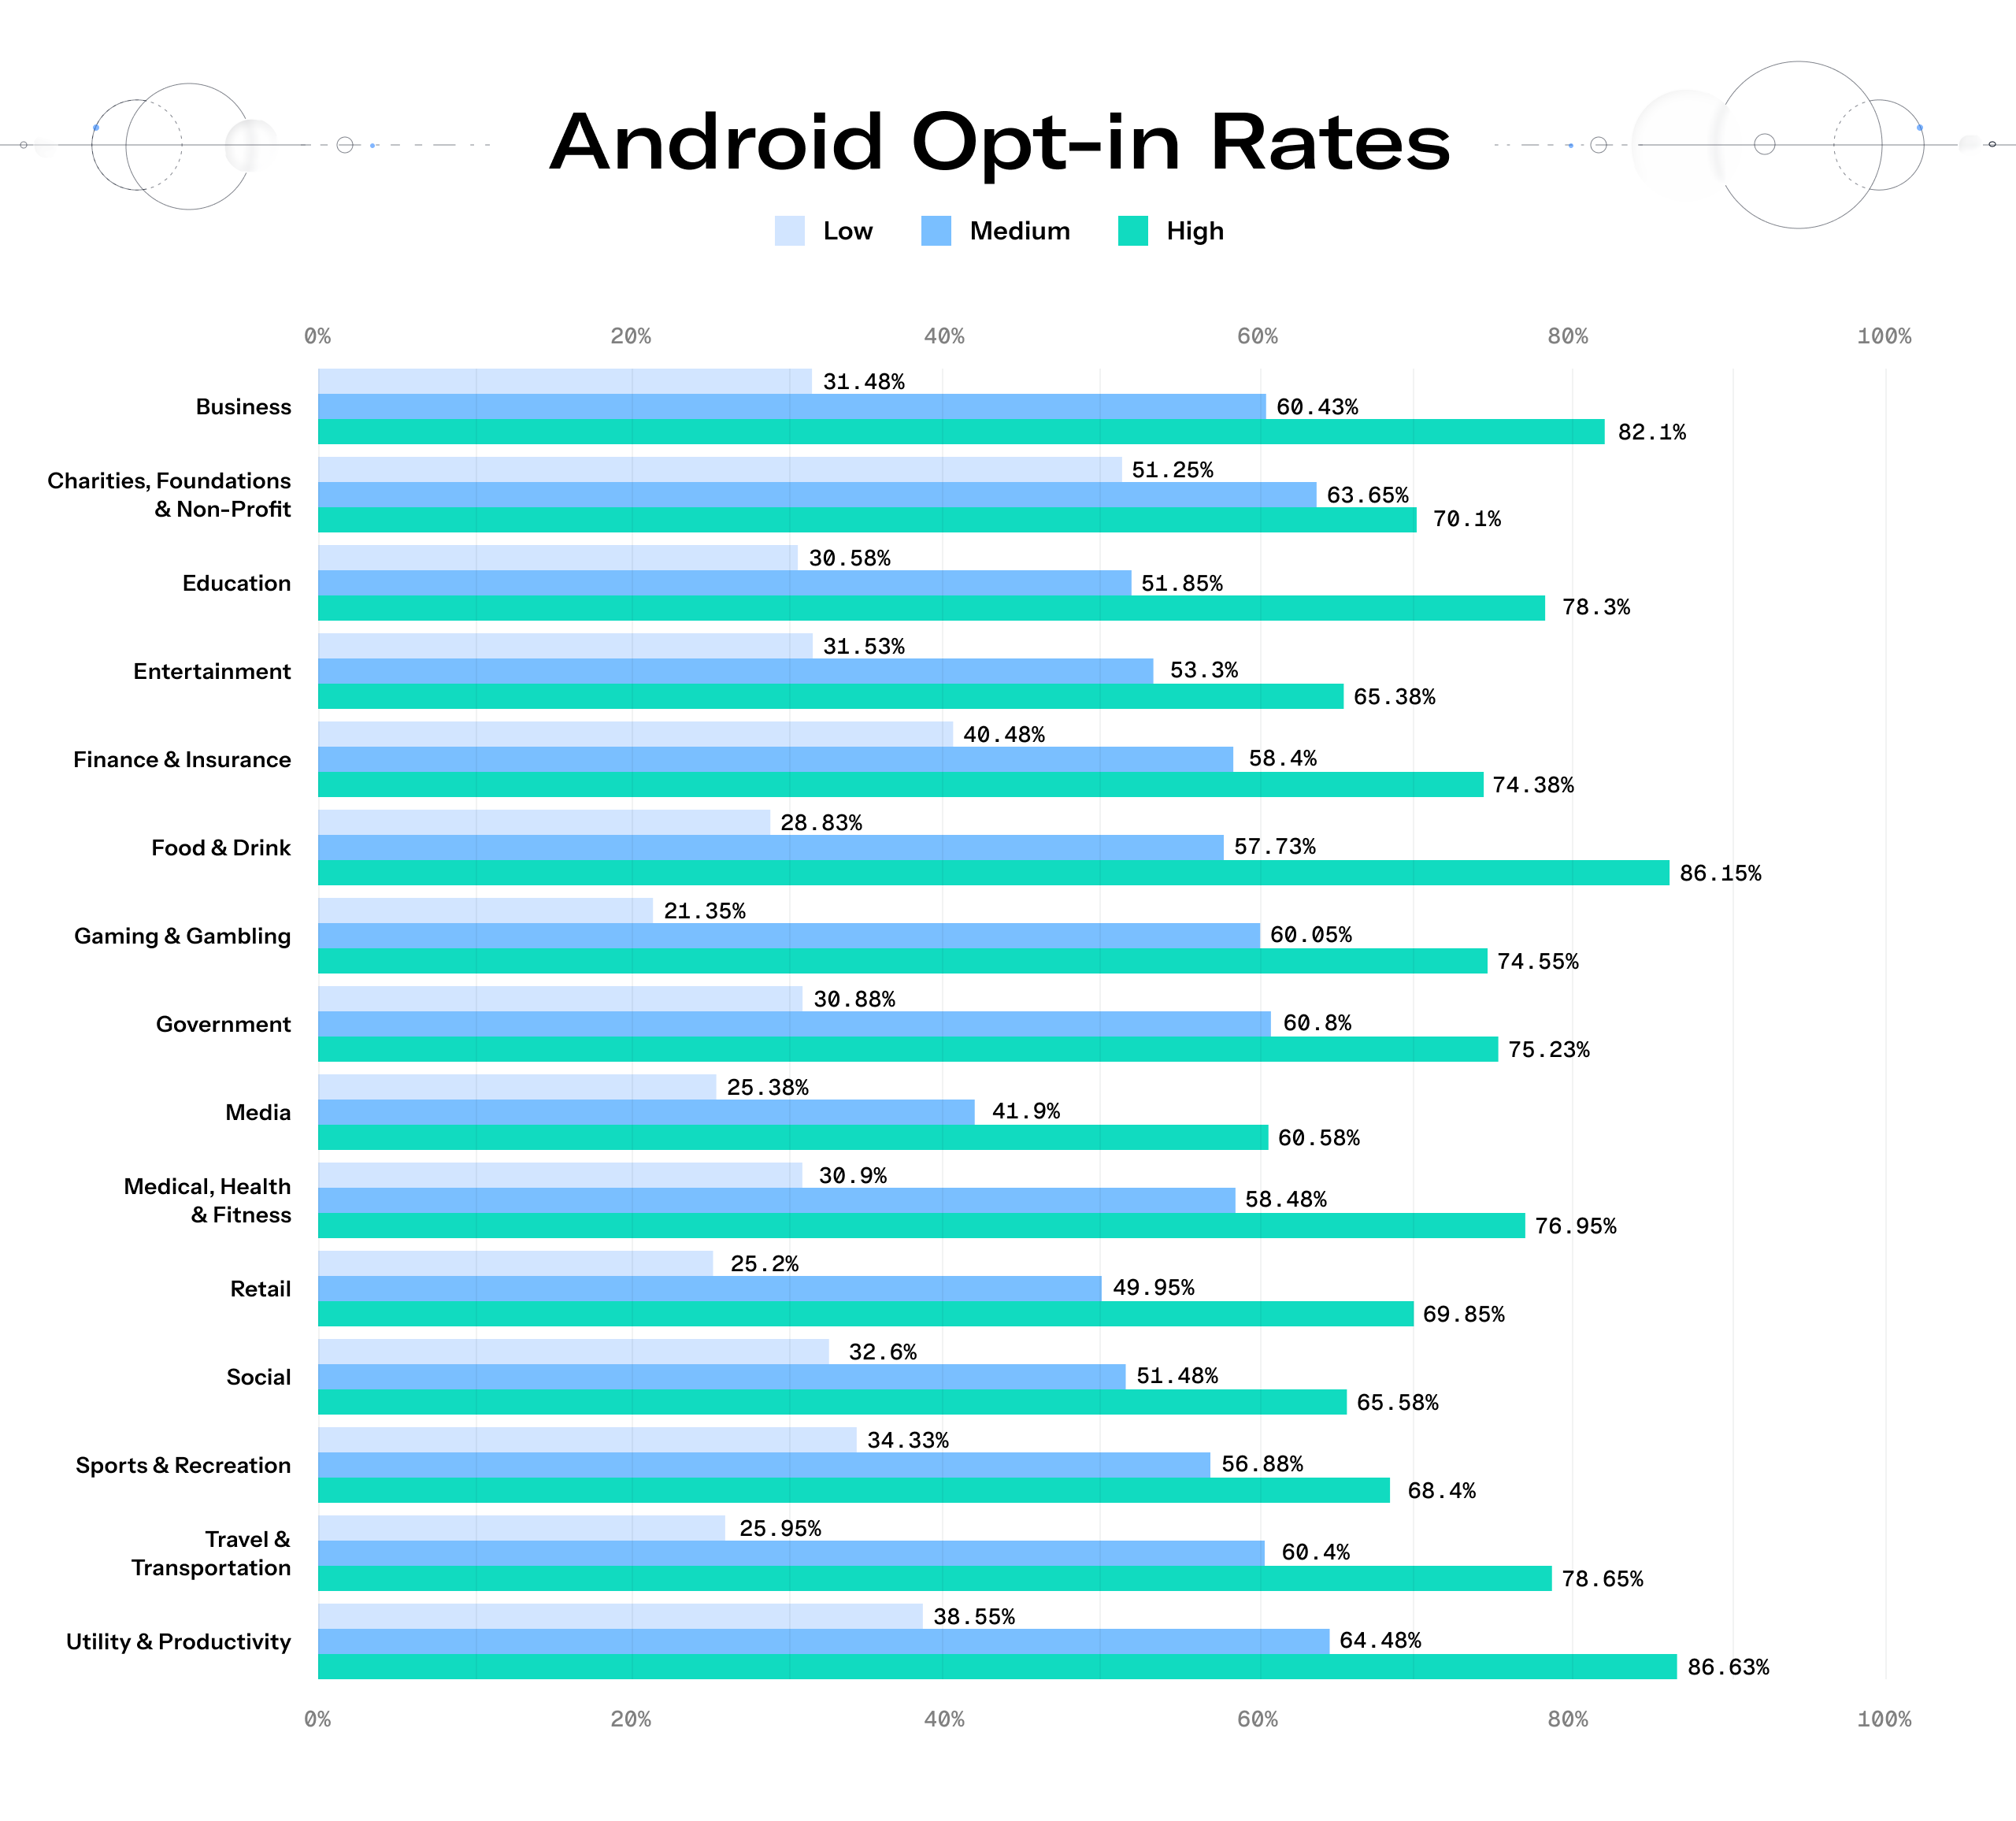
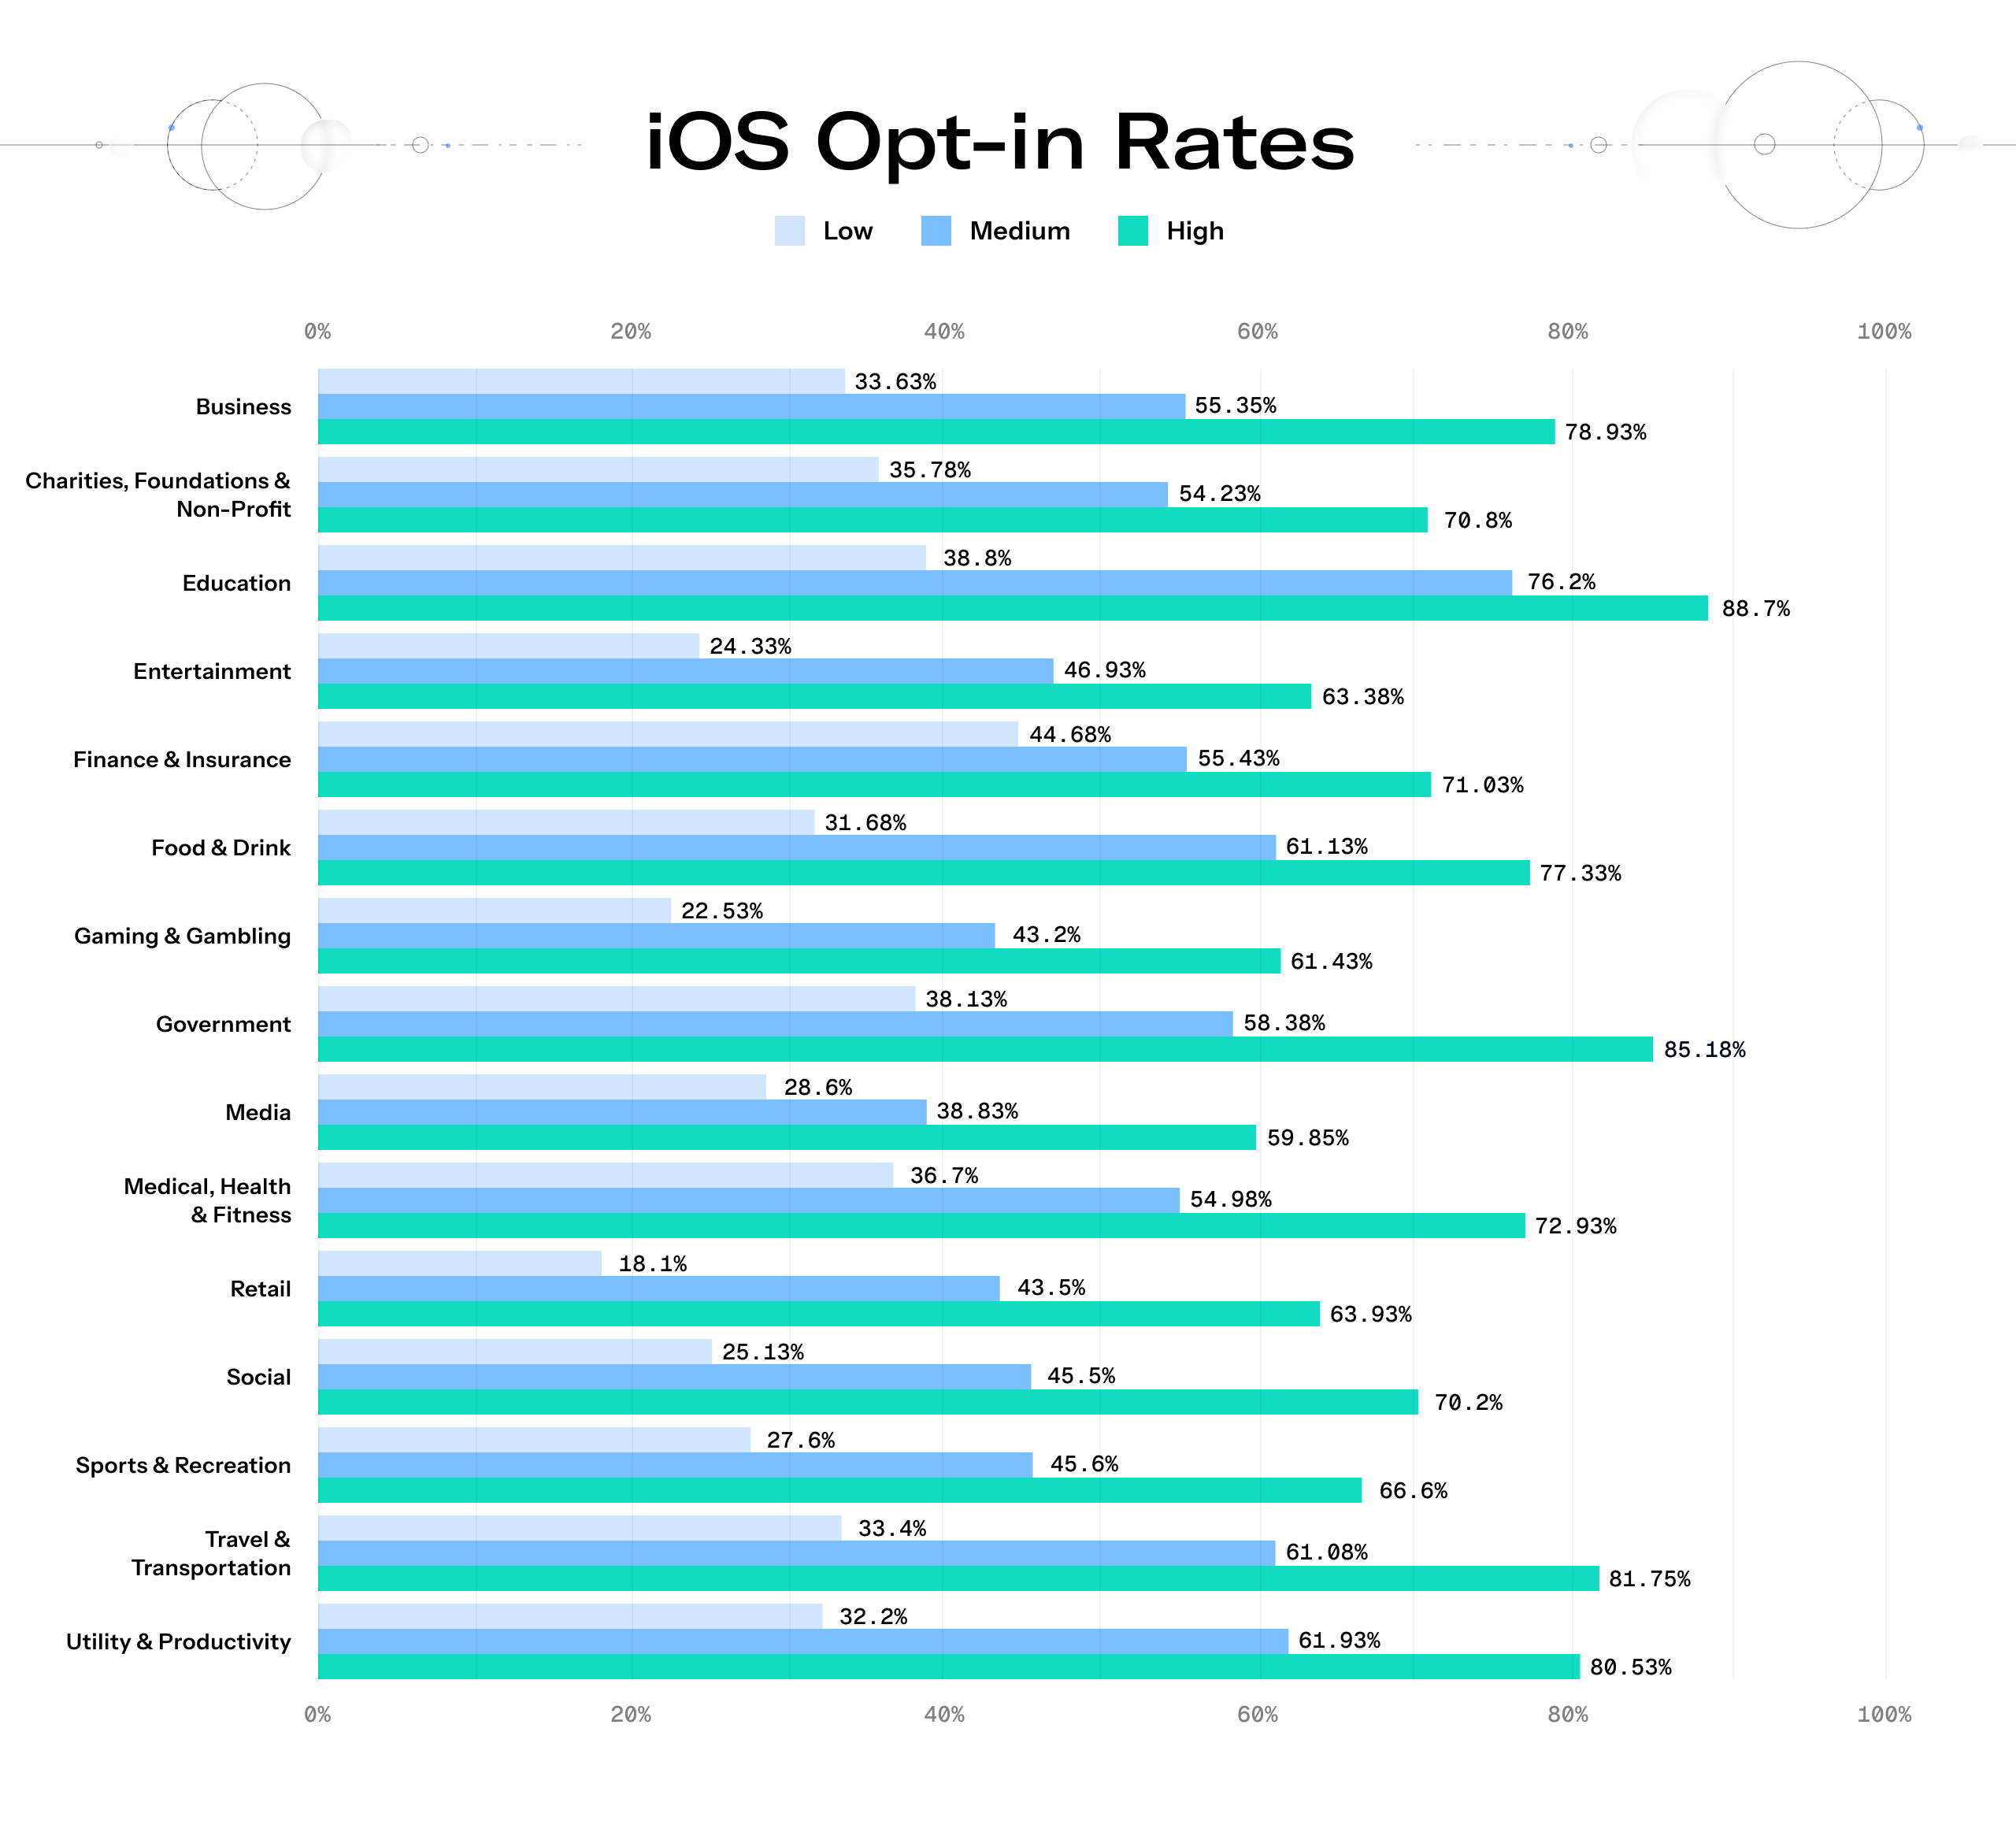
Apps that help consumers navigate their daily lives see top-tier opt-in rates. On Android, the Utility & Productivity vertical boasts the highest 90th percentile rate at 86.63%. On iOS, Education comes out on top, with apps capturing a massive 88.7% opt-in rate.
Consumers in these verticals view notifications as a functional necessity rather than a marketing message. Apps that send reminders to workout or study, for example, have clear utility for consumers.
On the other hand, even when campaigns underperform, high-trust verticals maintain remarkably stable baselines. On Android, Charities & Non-Profits command the highest baseline (10th percentile) at 51.25%. On iOS, Finance & Insurance sets the highest floor at 44.68%.
These verticals outperform the cross-industry low average of 31% to 32%. Charities & Non-Profits and Finance & Insurance apps create powerful, mission-critical incentives for users to stay connected. A user might be actively securing their financial livelihood or receiving on-the-ground impact updates from a disaster relief campaign.
2. In transactional verticals, execution is everything
There’s a massive spread between the 10th (Low) and 90th (High) percentiles, proving that a generic mobile strategy is a liability. In highly promotional or transactional spaces, the execution of your value exchange is especially make-or-break.
Food & Drink sees massive performance gaps across both platforms — a 57.32 percentage point spread on Android and a 49.63 point spread on iOS. Often, generic promotional blasts push away customers who are ruthless with their permissions. But if you orchestrate hyper-relevant journeys, like real-time delivery or location-based VIP rewards, you can expect to see above-average rates.
On the surface, sending mass promotional push notifications seems like a quick way to drive sales. But the Retail and Gaming verticals face some of the harshest realities if they’re not careful with their promotional blasts. Retail has the lowest floor on iOS at 18.1%, while Gambling & Gaming sees the lowest floor on Android at 21.35%.
A wide performance gap in your vertical means there’s competitive opportunity. Competitors relying on outdated batch-and-blast tactics are actively alienating their audiences. There’s an opening for brands that use intelligent, orchestrated messaging to win and retain those opt-ins.
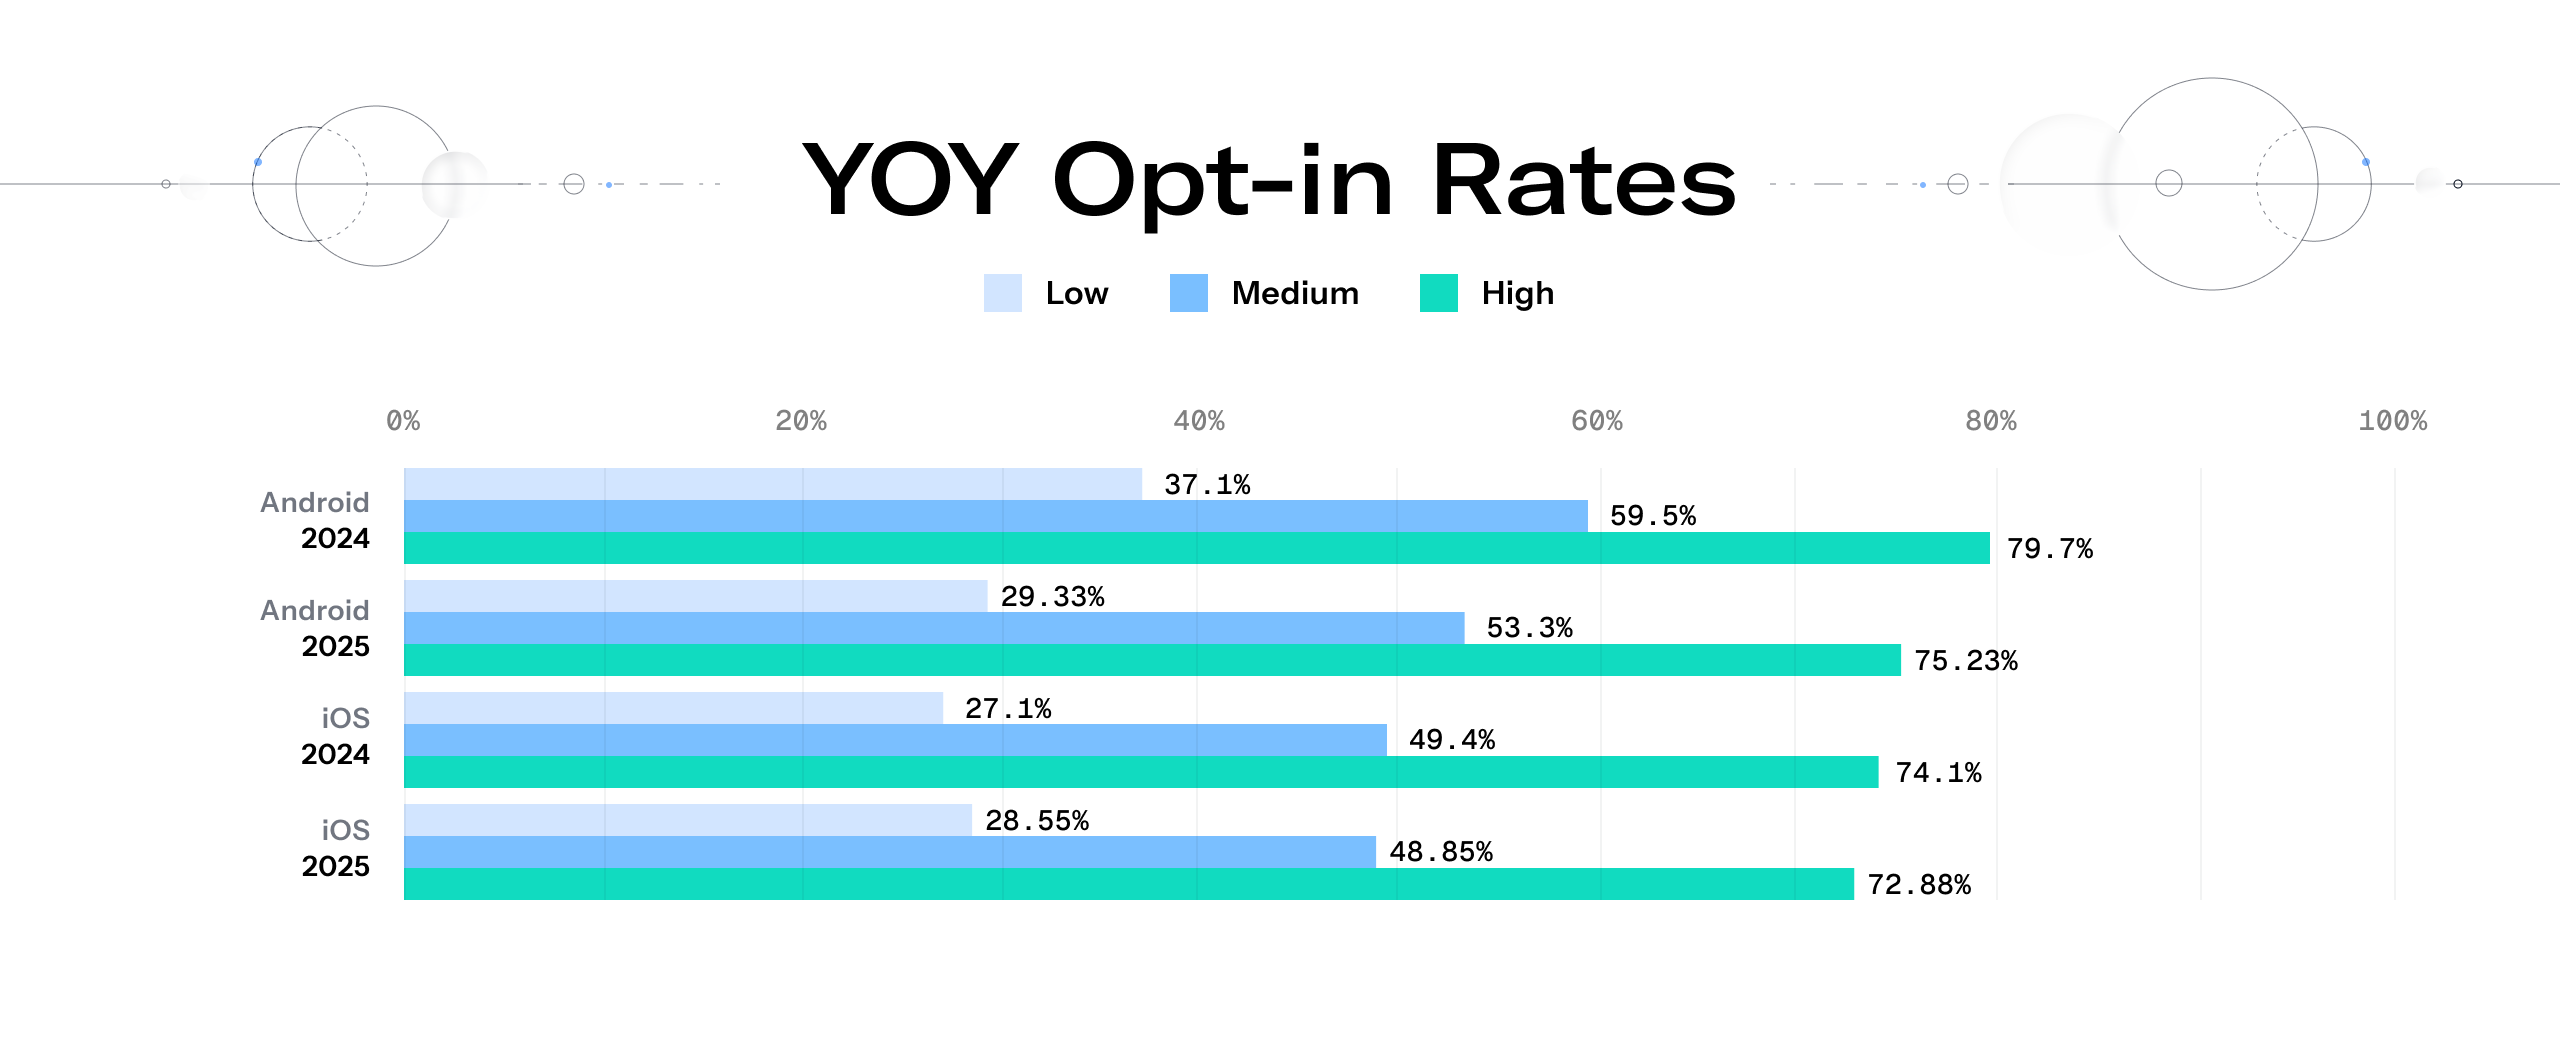
3. Android and iOS opt-in rates continue to converge
Historically, Android boasts higher opt-in rates than iOS. Historically, Apple’s operating system has always required explicit, proactive user permission to send push notifications, resulting in lower baseline opt-in rates compared to legacy Android versions. Meanwhile, Android features a more open, auto-opt-in approach, leading to comparably higher opt-in rates.
But our data signals an ongoing correction: the two platforms are rapidly converging. Android’s median now sits at 53.3% compared to iOS’s 48.85% — separated by less than five percentage points.
For brands, this means your strategy cannot exclusively rely on platform defaults to succeed. Instead, it now depends on mastering a universal value exchange, regardless of the device your customer uses.
Tips for securing push notifications opt-in rates
1. Start with your app’s unique value proposition
Customers are picky about their phone’s real estate. If they feel like your brand will spam them, they’ll opt out. But if you convey your app’s unique value proposition from the start, they’ll be much more likely to opt in to receiving push notifications.
Clearly explain your app’s value on your app store preview — then, position that app’s push notifications as an offer they can’t refuse. For example, a retailer might say “Get exclusive access to sales, available in-app only.”
You’ll want to especially reiterate your app’s value during onboarding. Our data shows that apps running onboarding campaigns see lifted opt-in rates, as high as 40% above their category average.
2. Prioritize preferences by creating custom notification settings
During your app’s onboarding process, let users know they can customize their notification settings. This might mean only receiving notifications for one set of products or during a certain time of day. Customers will be much more likely to opt in if they feel more in control of the process.
3. Offer an in-app exclusive deal
It’s common for brands to offer a coupon in exchange for an email address. You can deploy this exact same tactic to drive mobile growth. Offer in-app only deals on products, for example, or even in-app exclusive content.
4. Ask once, and if needed, set the stage to ask again
If a user opts out, don’t worry. It’s common for users to download an app and immediately opt out of push notifications. Simply ask once, and if they say no, set the stage to ask again.
Start by tracking their in-app behaviors. Did they view a particular product or service? Did they visit your “Deals” page? Any in-app activity that signals strong intent is a prime opportunity to trigger a new opt-in prompt. Using this in-app behavior, create a highly contextual, in-app message that targets the value they’re already getting by using your app.
Boosting opt-ins with Airship: Hawaiian Airlines

Push notifications direct open rates
What are push notification direct open rates?
The percentage of total push notifications sends within a month that successfully triggered a direct app open. To establish these benchmarks, we analyzed the monthly direct open rates per app and averaged them over a 12-month period.
Why do push notification direct open rates matter?
Direct open rates are a primary indicator of your mobile strategy’s ability to drive immediate, high-intent app engagement. But direct open rates are just one piece of the puzzle, especially as the lock screen becomes increasingly glanceable.
To understand how your push messaging influences long-term growth and retention, you must monitor this figure alongside downstream metrics like conversions, active users, indirect opens, opt-outs, and uninstalls. In other words, adopt an outcome-obsessed, holistic approach so you can start crafting intelligently orchestrated customer journeys.
Still, direct open rates often correlate to these downstream metrics. Here’s how optimizing your direct open rates helps you drive real results:
Turns targeted opens into tangible revenue
When campaigns are intelligently targeted rather than blasted to a mass audience, opens directly drive revenue. A leading entertainment brand found that using audience targeting created a 46% lift in direct open rates, which resulted in a massive 68% lift in purchases attributed to push.
Directly scales retail transactions
The correlation between opens and transactions holds strong in the retail sector. A top cosmetics brand saw a 23% increase in direct open rates translate to a proportionate 25% lift in overall purchases.
Drives media and content consumption
For non-retail brands, direct opens are the ultimate gateway to consumption. A major sports media publisher saw a 56% increase in direct opens correlate directly with a 50% increase in total streaming time.
Android vs. iOS
Across industry verticals, engagement with Android notifications traditionally maintains a noticeable lead over iOS. This performance gap comes down to fundamental differences in operating system architecture rather than audience preference.
When a user unlocks an Android device, notifications persist prominently on the lock screen, requiring the user to actively swipe left or right to dismiss them. On iOS, notifications vanish from the lock screen the moment the device is unlocked, quietly grouping with the app’s other messages in the Notification Center. For mobile teams, this means iOS campaigns require an incredibly strong value exchange to capture a user’s attention before that screen unlocks.
Three takeaways for push notifications direct open rates
1. Critical information commands the highest direct opens
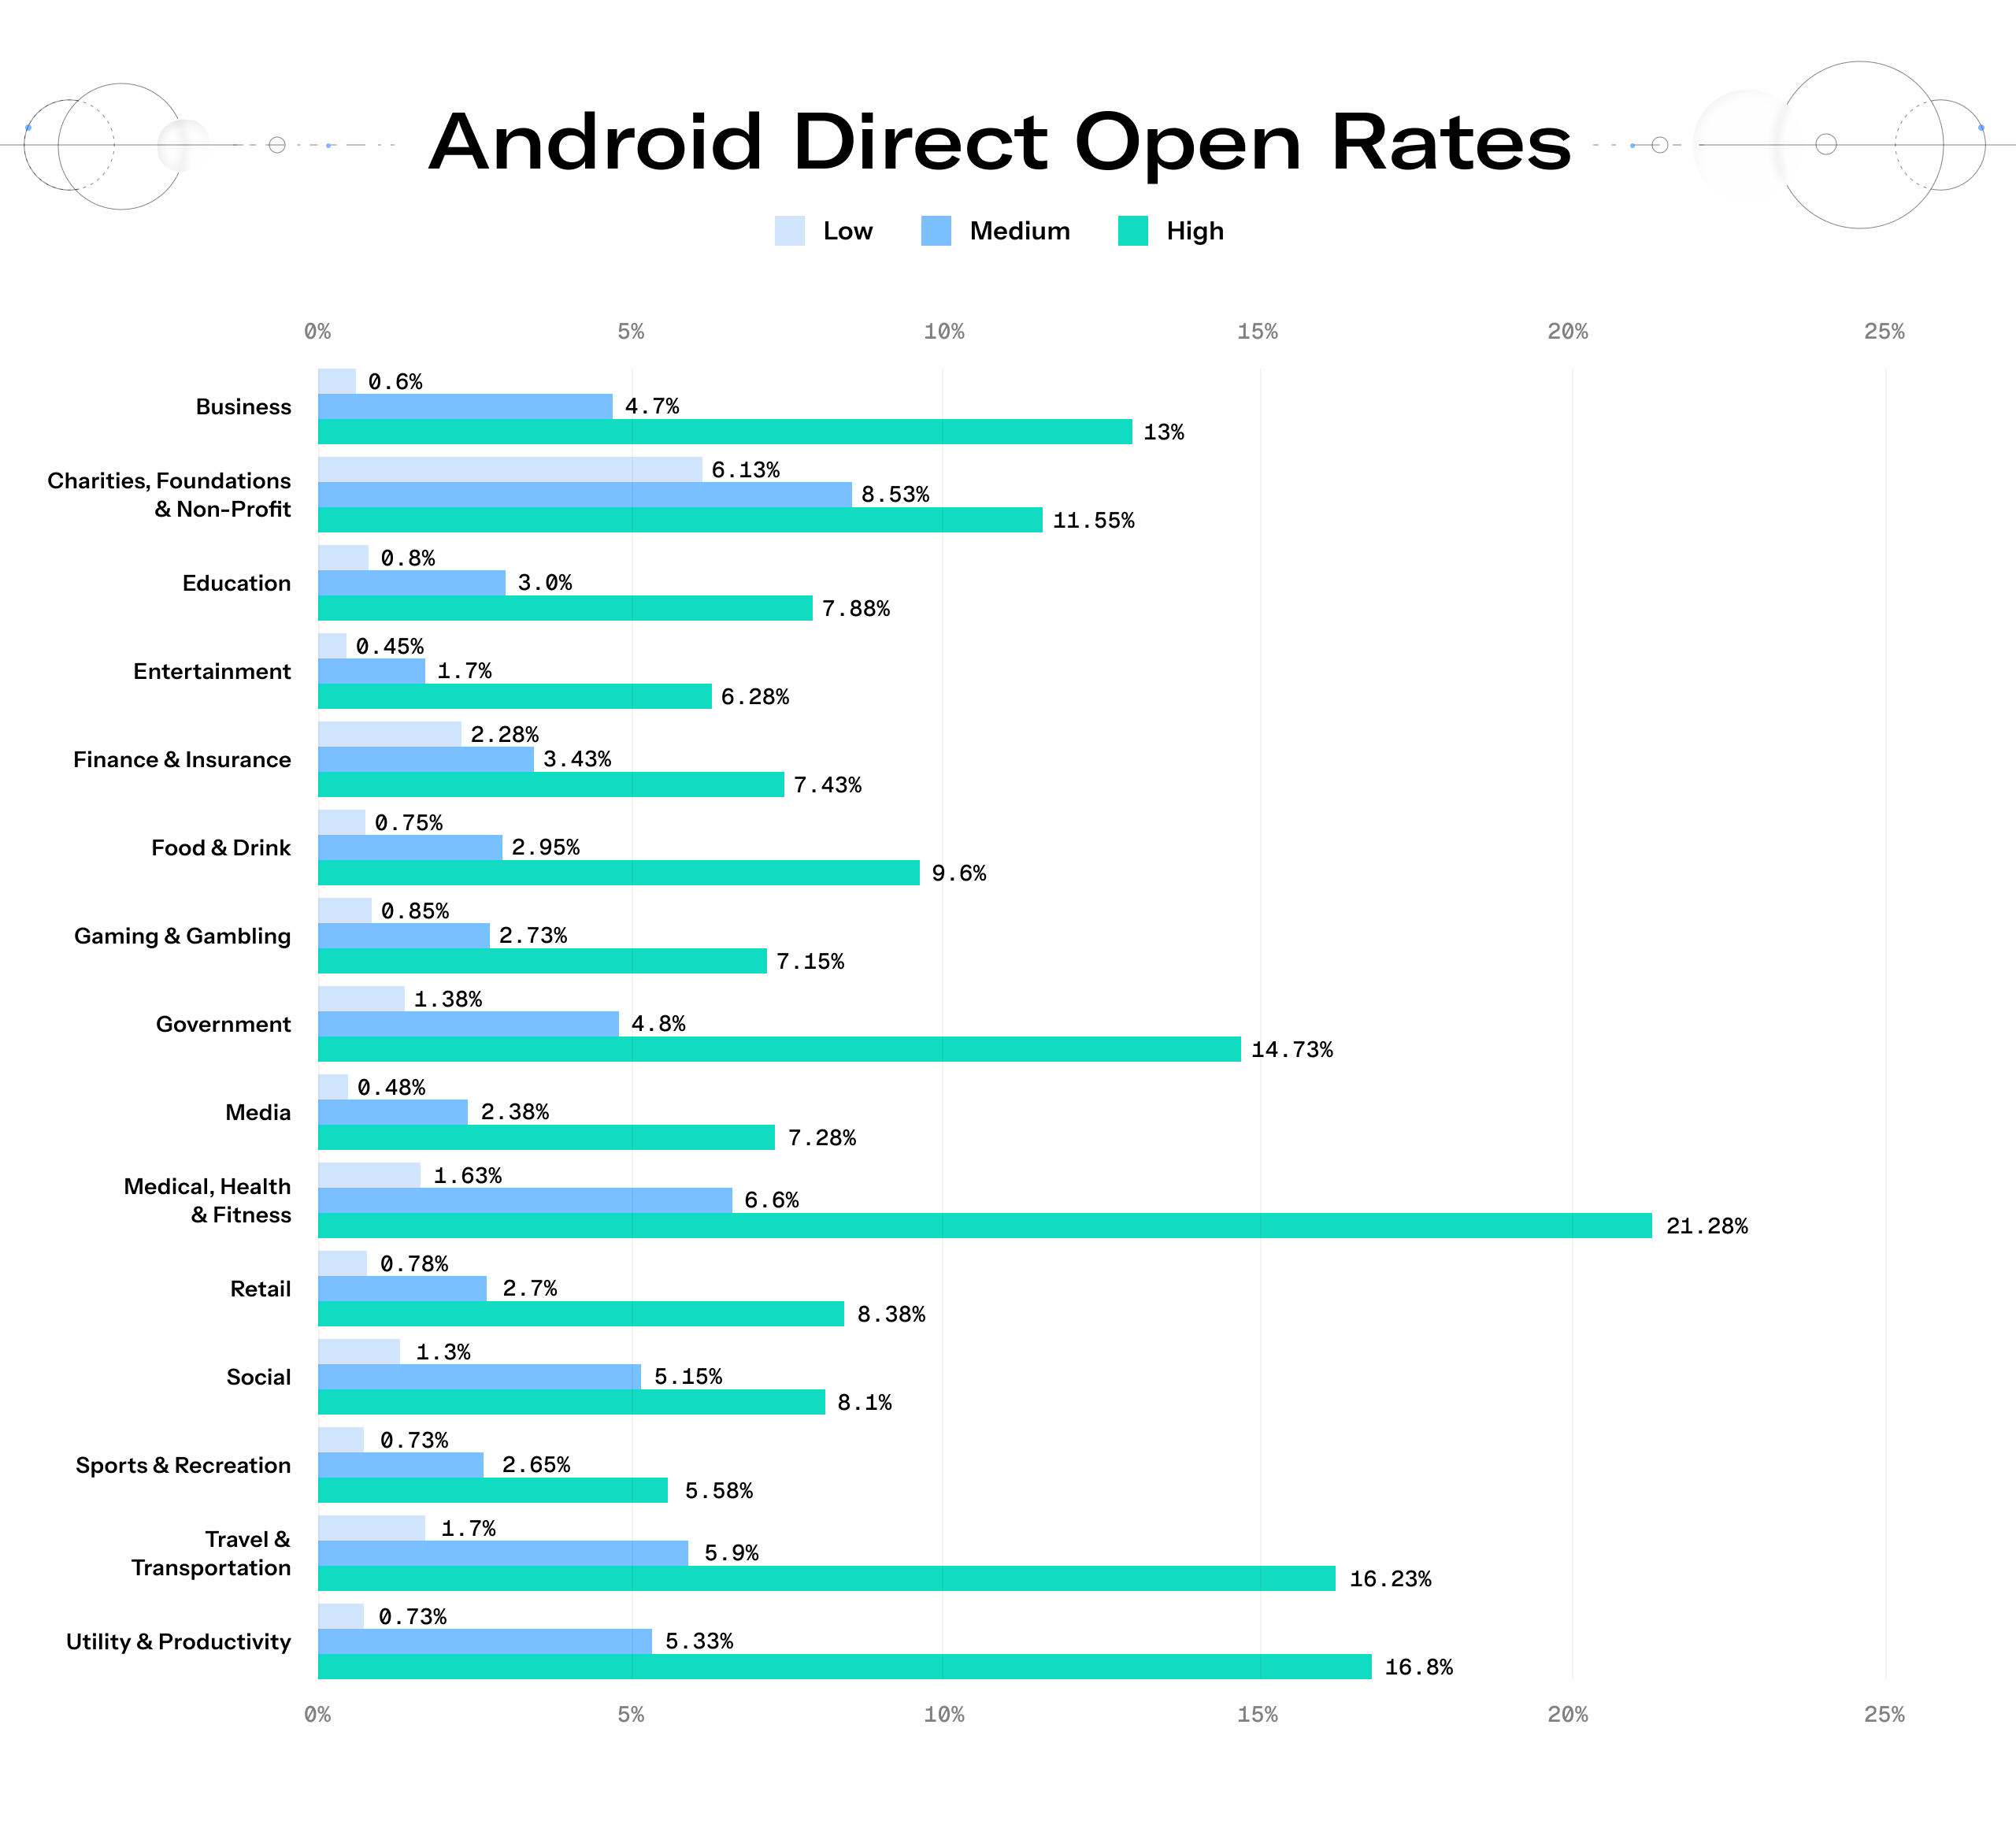
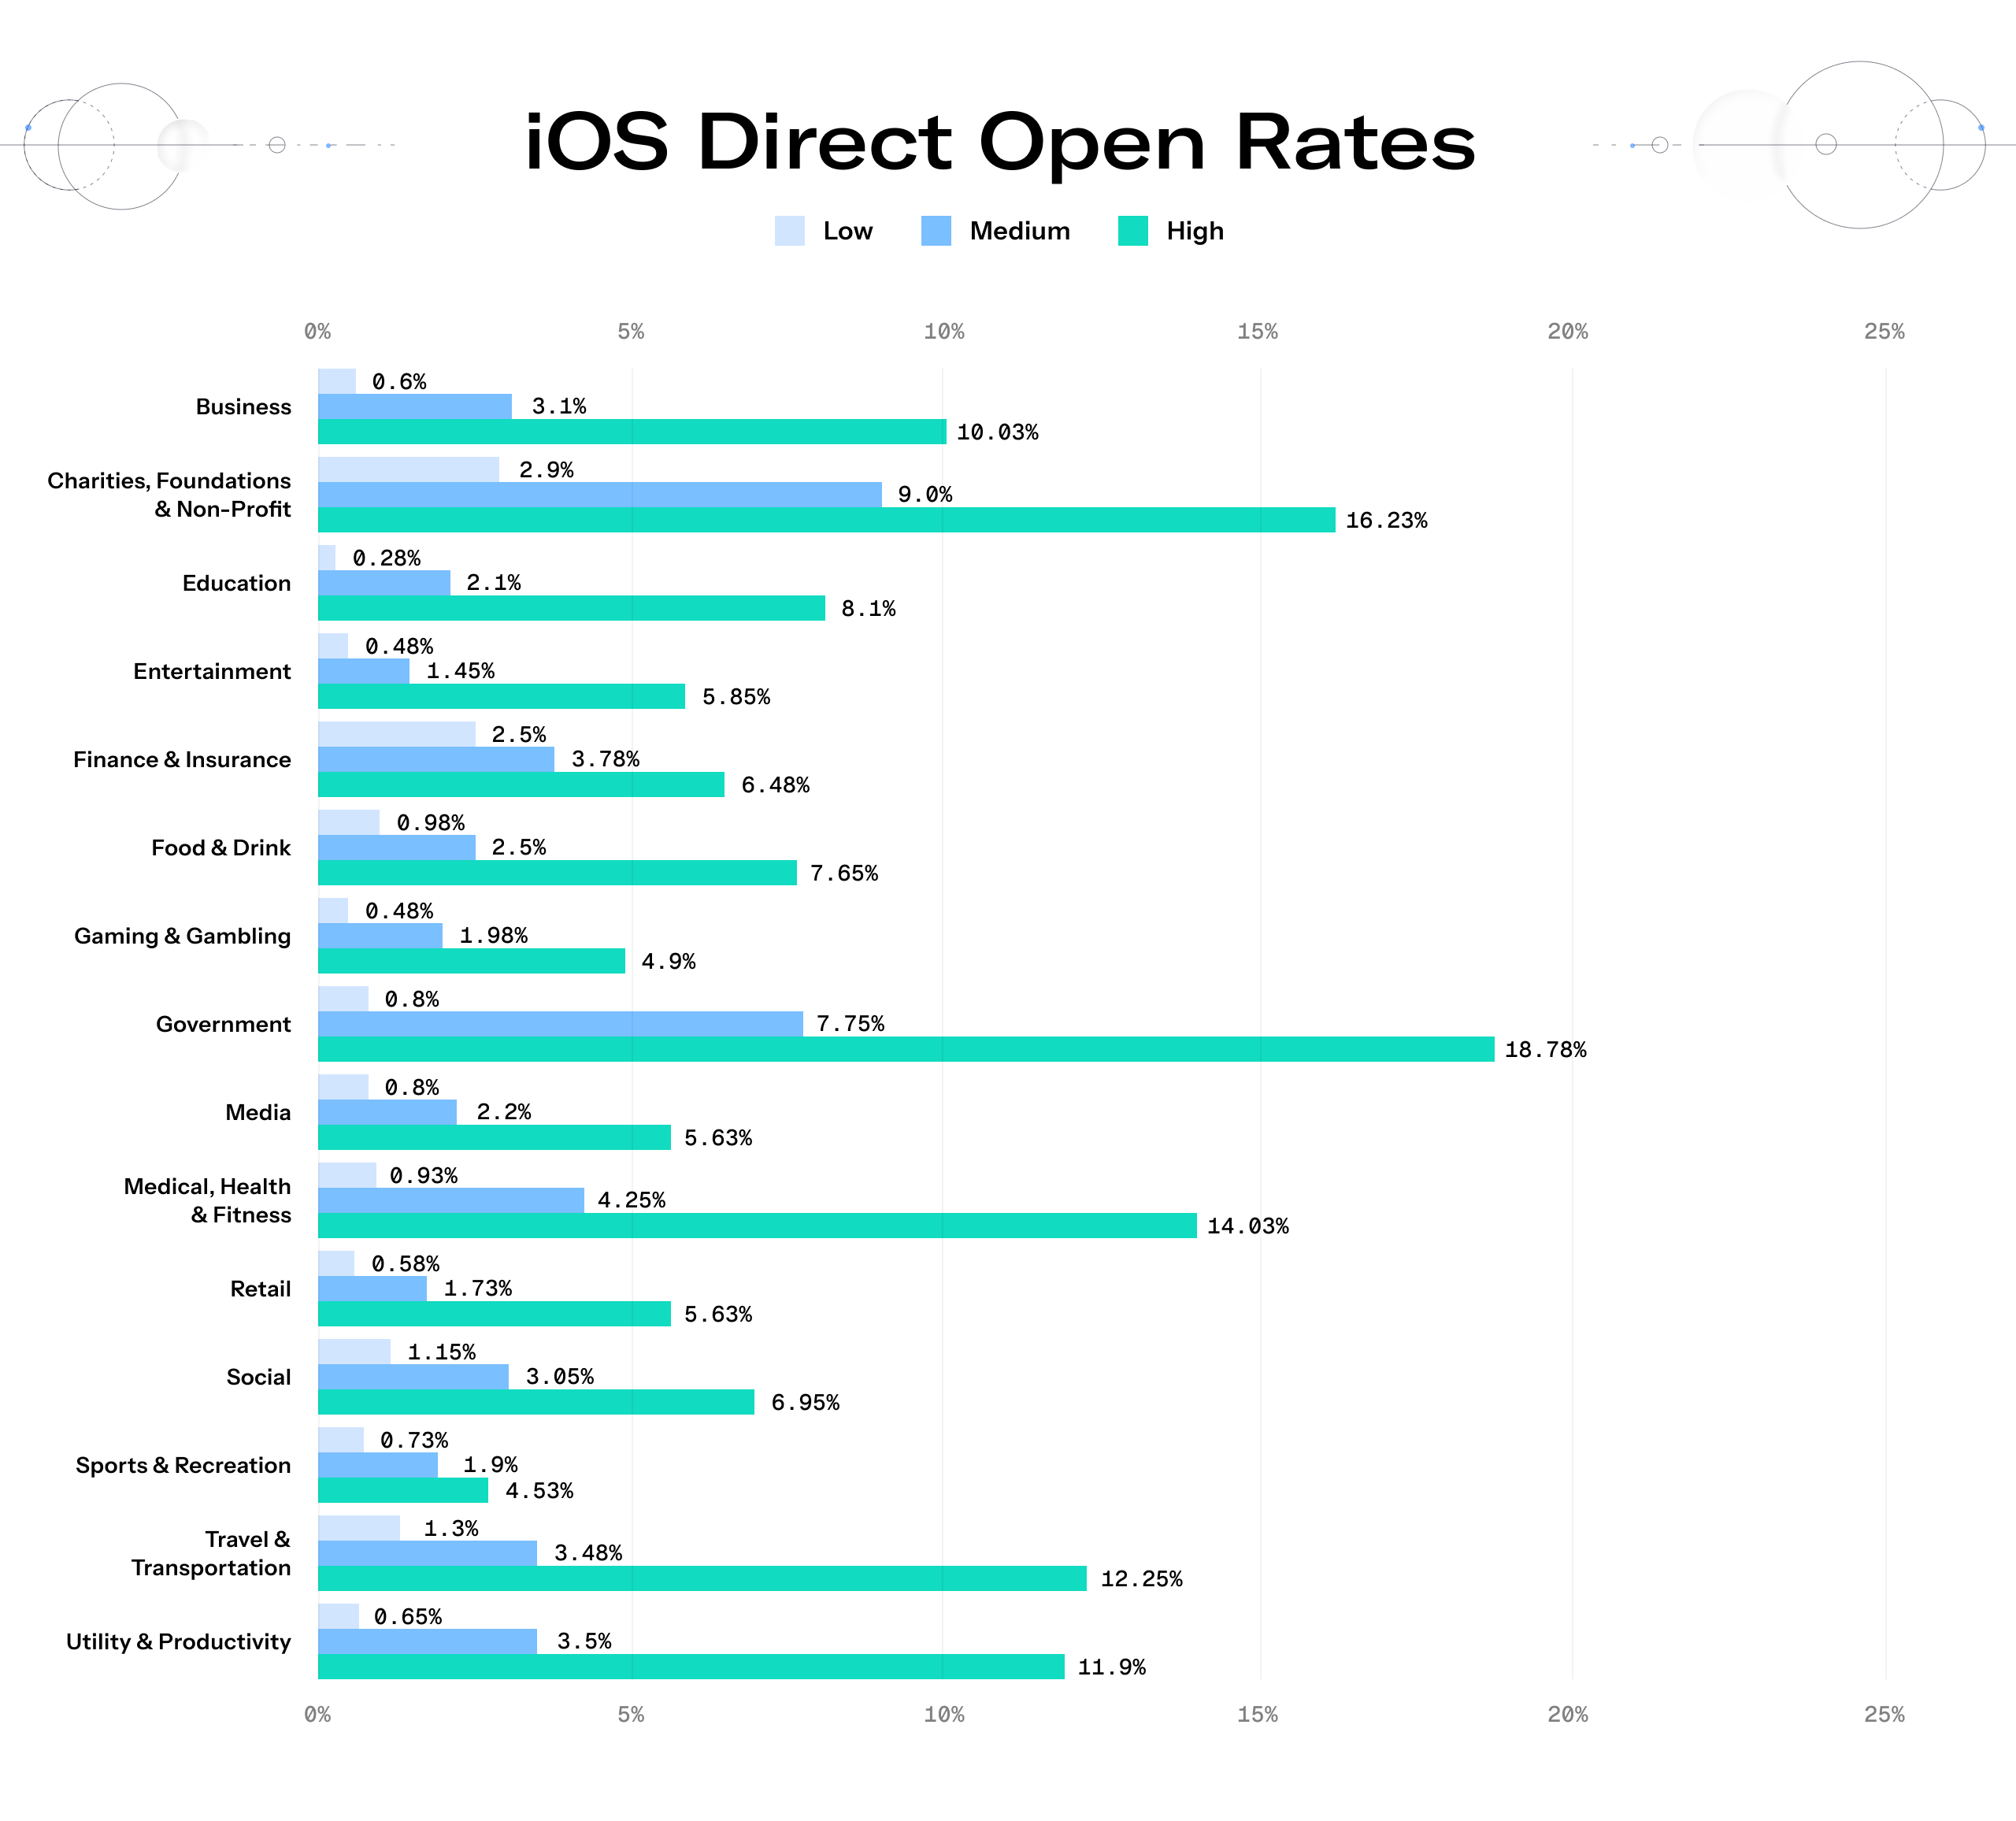
Across Android and iOS, the highest direct open rates belong to verticals that deliver highly personal, urgent, or mission-critical information.
On Android, the Medical, Health & Fitness vertical boasts a whopping 90th percentile rate of 21.28% — nearly double the overall average. On iOS, Government apps took the lead, hitting an 18.78% top-tier rate. This aligns perfectly with the core use cases of these apps. A user might be reviewing secure lab results or reading an urgent civic alert, both high-stakes interactions that compel users to tap.
Just as we noted with opt-in rates, Charities, Foundations & Non-profits maintain strong baselines. They have the strongest 10th percentile floor on Android (6.13%) and iOS (2.90%). This proves that when users truly believe in your brand’s mission, they engage — not just for charities, but for any business.
2. Entertainment and Education suffer with sub-1% floors
High-utility apps soar. But verticals that rely on promotional blasts or generic content face a brutal reality check. If a notification doesn’t offer immediate value, consumers swipe it away.
This is most clear in the Entertainment and Education verticals, where the cost of poor execution is steep. The Entertainment vertical suffers the lowest floor on Android (0.45%), while Education bottoms out on iOS (0.28%). This means the lowest-performing campaigns in these sectors can barely get even a fraction of a percent of their audience to open the app. If you’re still sending generic, untargeted “Check out our new content” or “Don’t forget to log in” blasts, your audience is actively ignoring you.
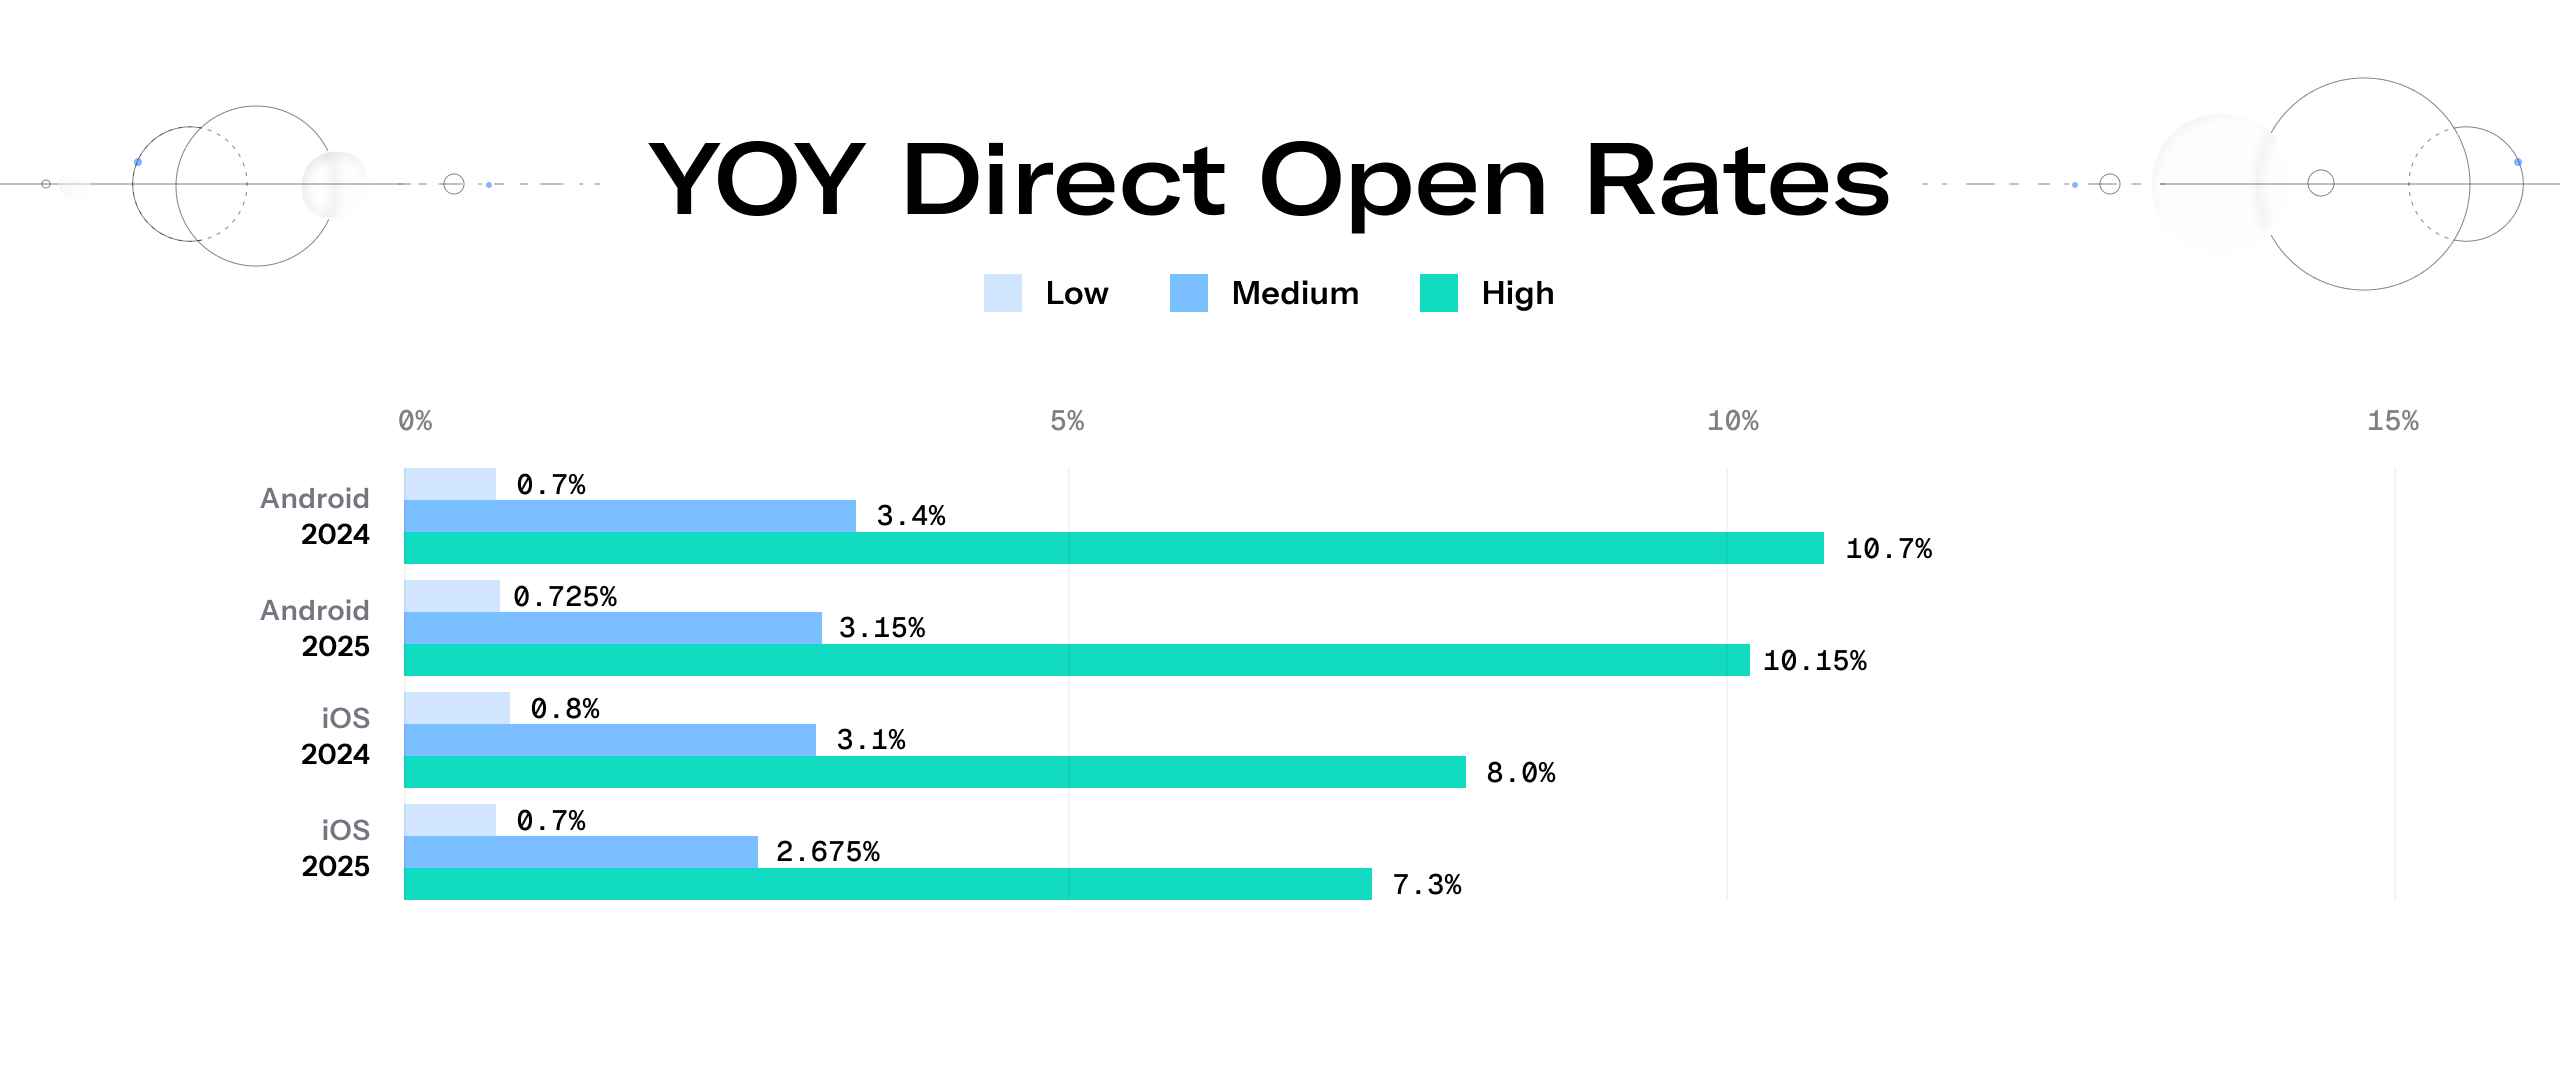
3. The lock screen is the new landing page
The year-over-data paints a clear picture: direct open rates are declining, a consequence of the modern “glanceable” mobile experience.
Across iOS and Android, direct open rates are compressing. iOS direct open rates’ median dropped by 13.71%, while Android’s median and high tiers also saw single-digit declines. In fact, the only metric that improved year-over-year was the bottom 10% of Android campaigns.
These declines don’t necessarily point to channel fatigue. Rather, it’s a sign that rich push notifications might be doing their job too well. Users are getting the information they need — a sports score, a delivery update, a flight delay — from the push notification itself. This is especially true for brands deploying Live Activities, which displays even more information directly on the lock screen. If your notification delivers the full value immediately, a direct open is no longer the only metric of success.
Tips for improving direct open rates
1. Leverage zero-party data
Third-party data is the past; zero-party data is the future. Relying on guesswork or outdated tracking doesn’t work anymore. Instead, actively leverage zero-party data — the specific preferences and interests customers explicitly share with you.
Our data shows brands that use zero-party data see an 82% lift in direct open rates. To orchestrate journeys that actually convert, build your audiences based on what your customers clearly tell you they want.
2. Move beyond first-name personalization
Customers now expect basic first-name personalization across every channel. Because it is the bare minimum, simply dropping a name into a message is no longer enough to compel a user to unlock their screen.
Brands that deploy advanced personalization, incorporating recent app behaviors, localized context, or specific milestones in the customer journey, achieve a 37% average lift in direct open rates according to Airship findings.
3. Feature rich media like images or video
A standard wall of text is easily dismissed on a highly competitive lock screen. By embedding rich push content, such as high-resolution images or video, directly into your notifications, you can drive an average 22% lift in direct open rates according to Airship research. It’s about making the value of your message visually undeniable before the user even unlocks their phone.
Increasing direct opens with Airship: bol

Average monthly push notifications per user
What are average monthly push notifications per user
The average number of push notifications an app sends to an individual user within a single month.
Why do average monthly push notifications per user matter?
Without measuring your current efforts against industry standards, it’s difficult to know if you should send more or less push notifications. Tracking your monthly send volume is critical for balancing active engagement against the very real risk of notification fatigue.
When orchestrated intelligently, higher frequency drives tangible results: our engagement benchmarks reveal that top-performing apps (those sitting in the 90th percentile for sends per user) see a 72% average increase in sessions per active user compared to their category average.
But there is a fine line brands must walk. Overcommunicating erodes customer trust. In fact, our Global Consumer Survey Report reveals that the top reason users opt out is because messages get sent “too frequently.”
Still, it’s critical to benchmark your current send volume against your industry. But remember that relevance and personalization often matter far more than message volume. It would be a mistake to assume that sending more push notifications always drives more conversions.
Variations across industries
Average monthly push notifications per user varies significantly across industries, meaning there isn’t a “magic number” to target. Media and sports brands, for example, naturally maintain a higher volume of sends to deliver breaking news and real-time game updates. Conversely, brands in travel, transportation, and food typically send fewer notifications, focusing their outreach on specific, high-intent transactional moments.
As you review these benchmarks, make sure you’re evaluating them through the lens of your industry context. The core type of your notifications, whether they are promotional, transactional, educational, or engagement-based, will dramatically dictate your ideal volume.
Three takeaways for average monthly push notifications per user
1. Brands are running two distinct volume strategies
Looking at the year-over-year data reveals a divergence in how apps are managing their messaging frequency. Instead of a uniform trend across the industry, the market is splitting into two different camps: the aggressive top tier and the conservative majority.
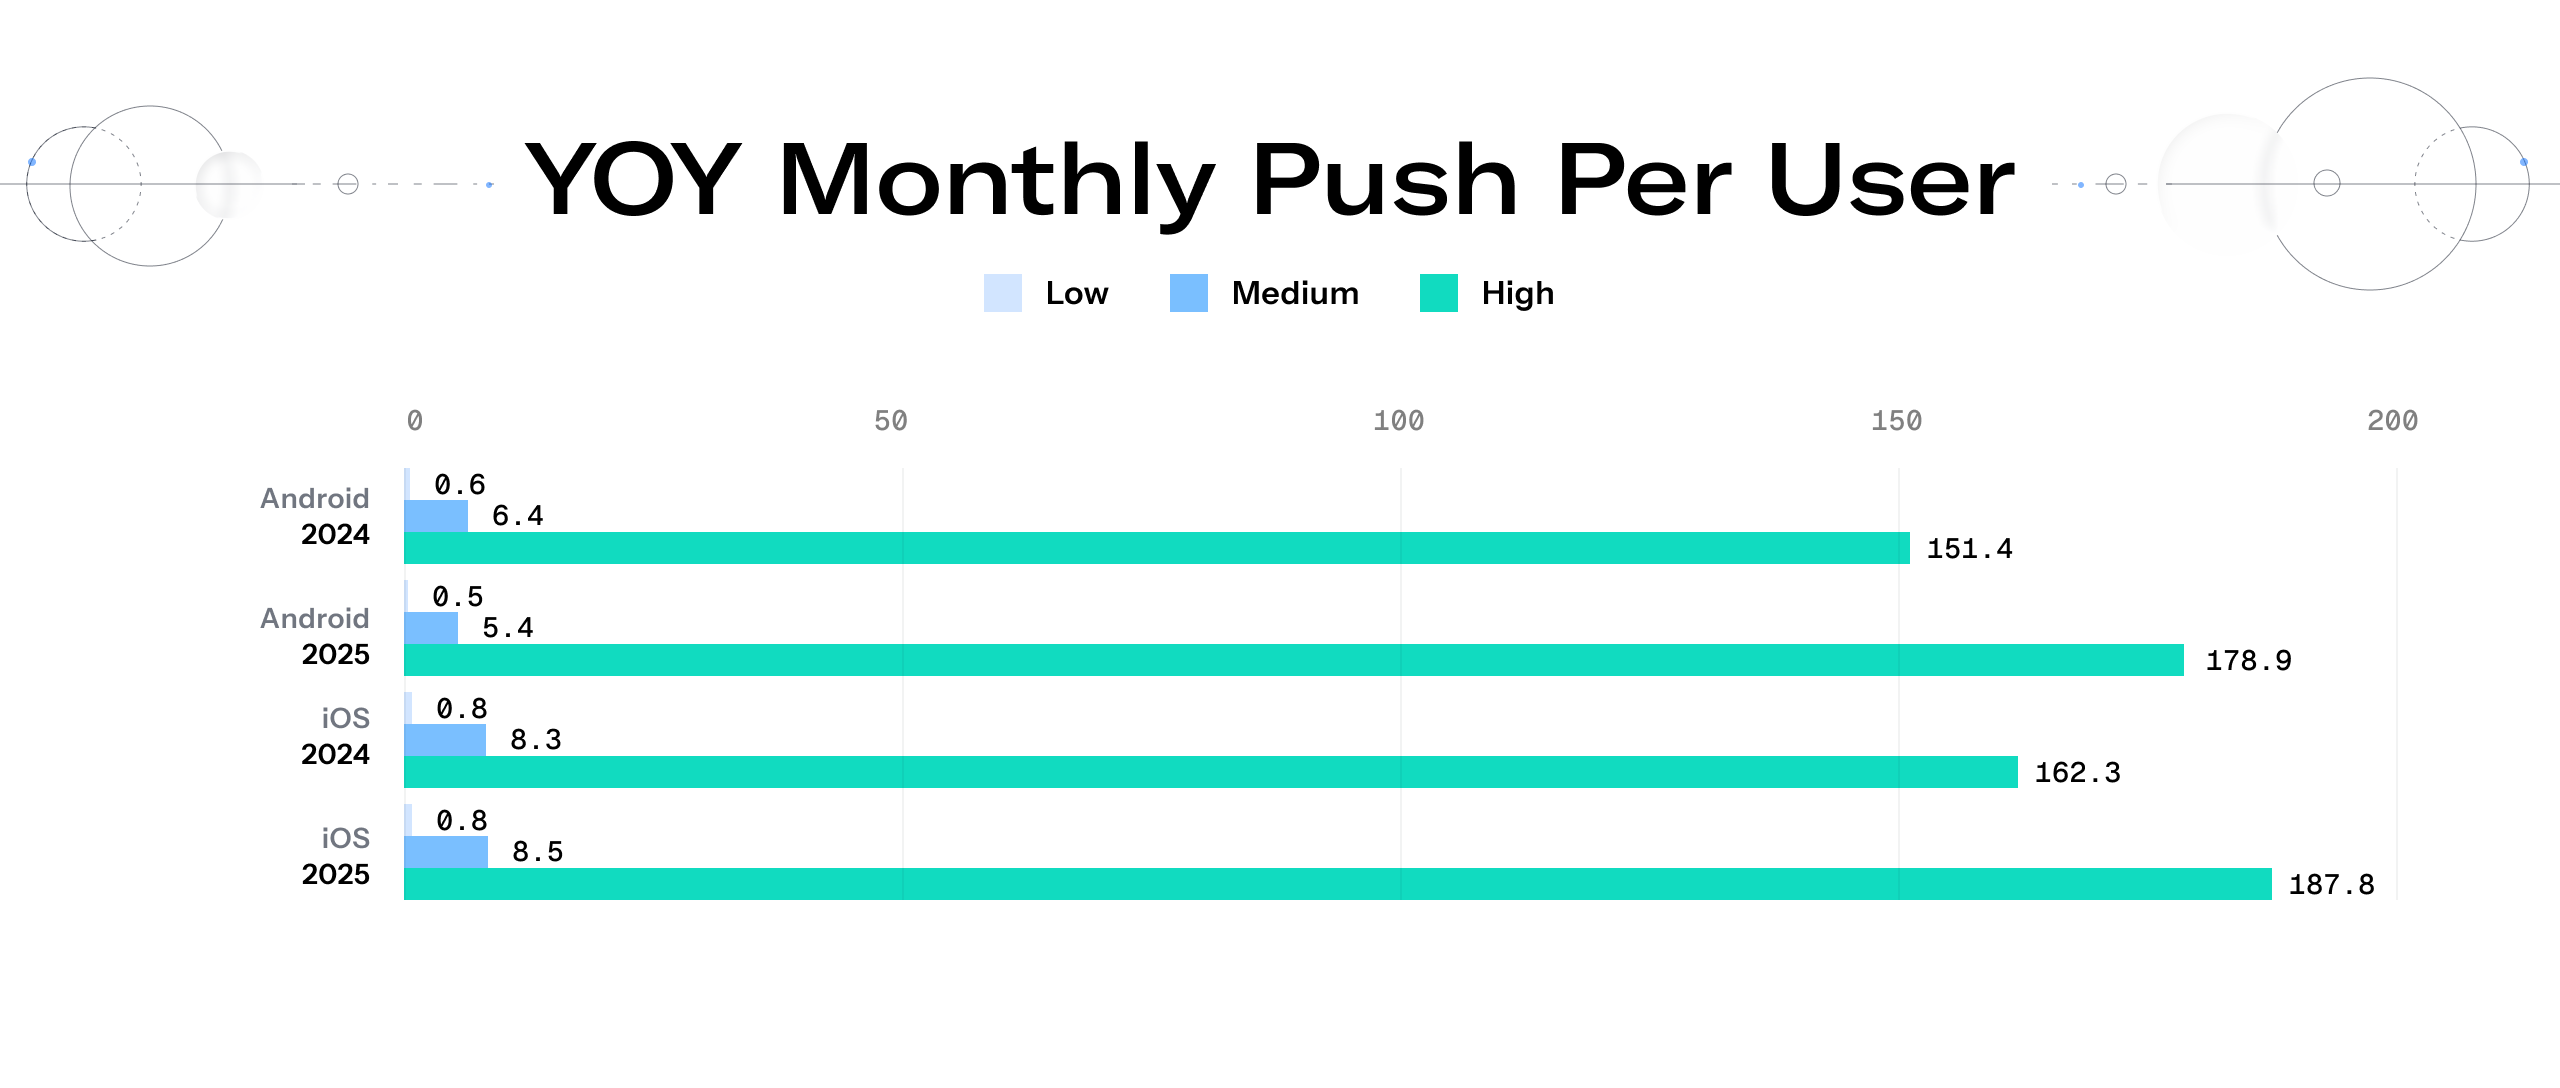
The apps that already send the most notifications (the 90th percentile) drastically increased their monthly output. On iOS, the high-tier volume jumped 15.71% to 187.8 pushes per user, while Android’s high tier climbed 18.16% to 178.9 pushes per user. The highest-volume senders are doubling down and sending even more.
While the top accelerates, the rest of the market is trending down. Android’s median and low-tier campaigns dropped their volume by 15% year-over-year. Meanwhile, the iOS median saw only a marginal 2.41% increase, and its bottom tier remained flat. For the majority of apps, the strategy is shifting toward volume reduction or strict maintenance.
These distinct volume strategies tell a clear story: the middle ground is disappearing. The top 10% are sending significantly more, while the bottom 90% are sending less or holding steady, widening the gap between the two. You must make a deliberate choice: either your app’s core value requires a high-frequency, continuous alert model, or it requires a highly conservative, strictly curated approach.
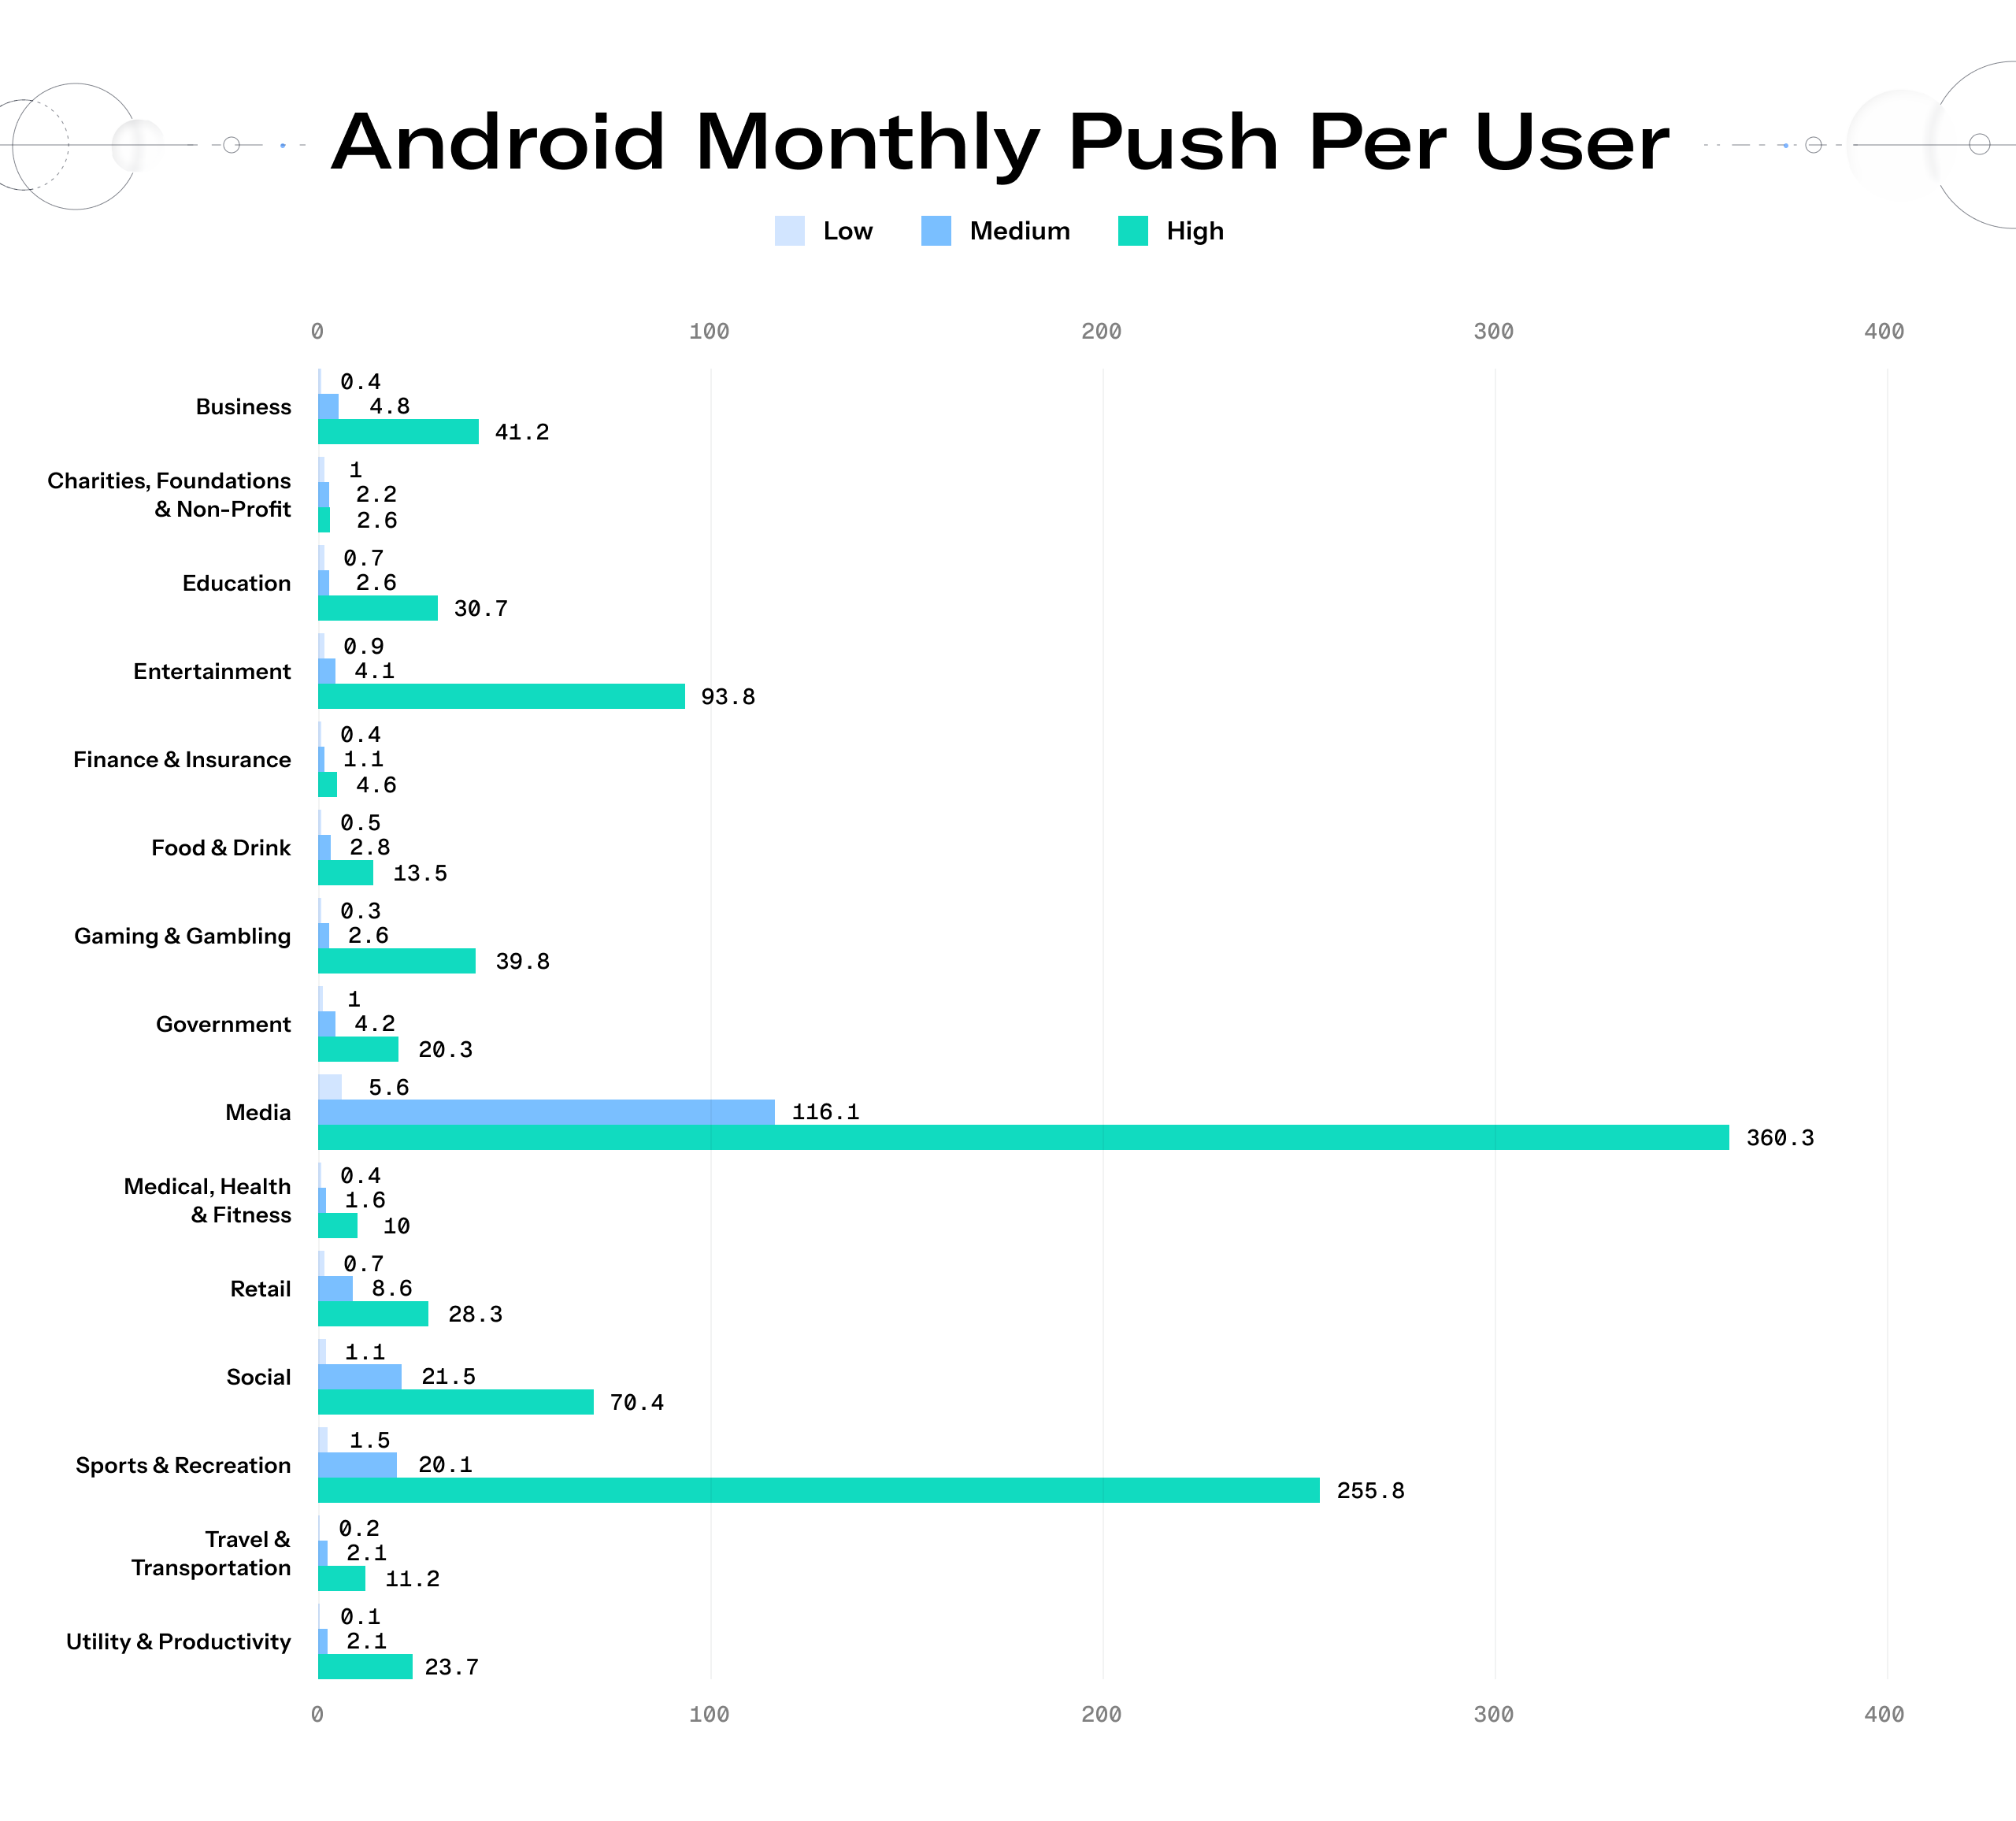
2. Content-driven verticals play by different rules
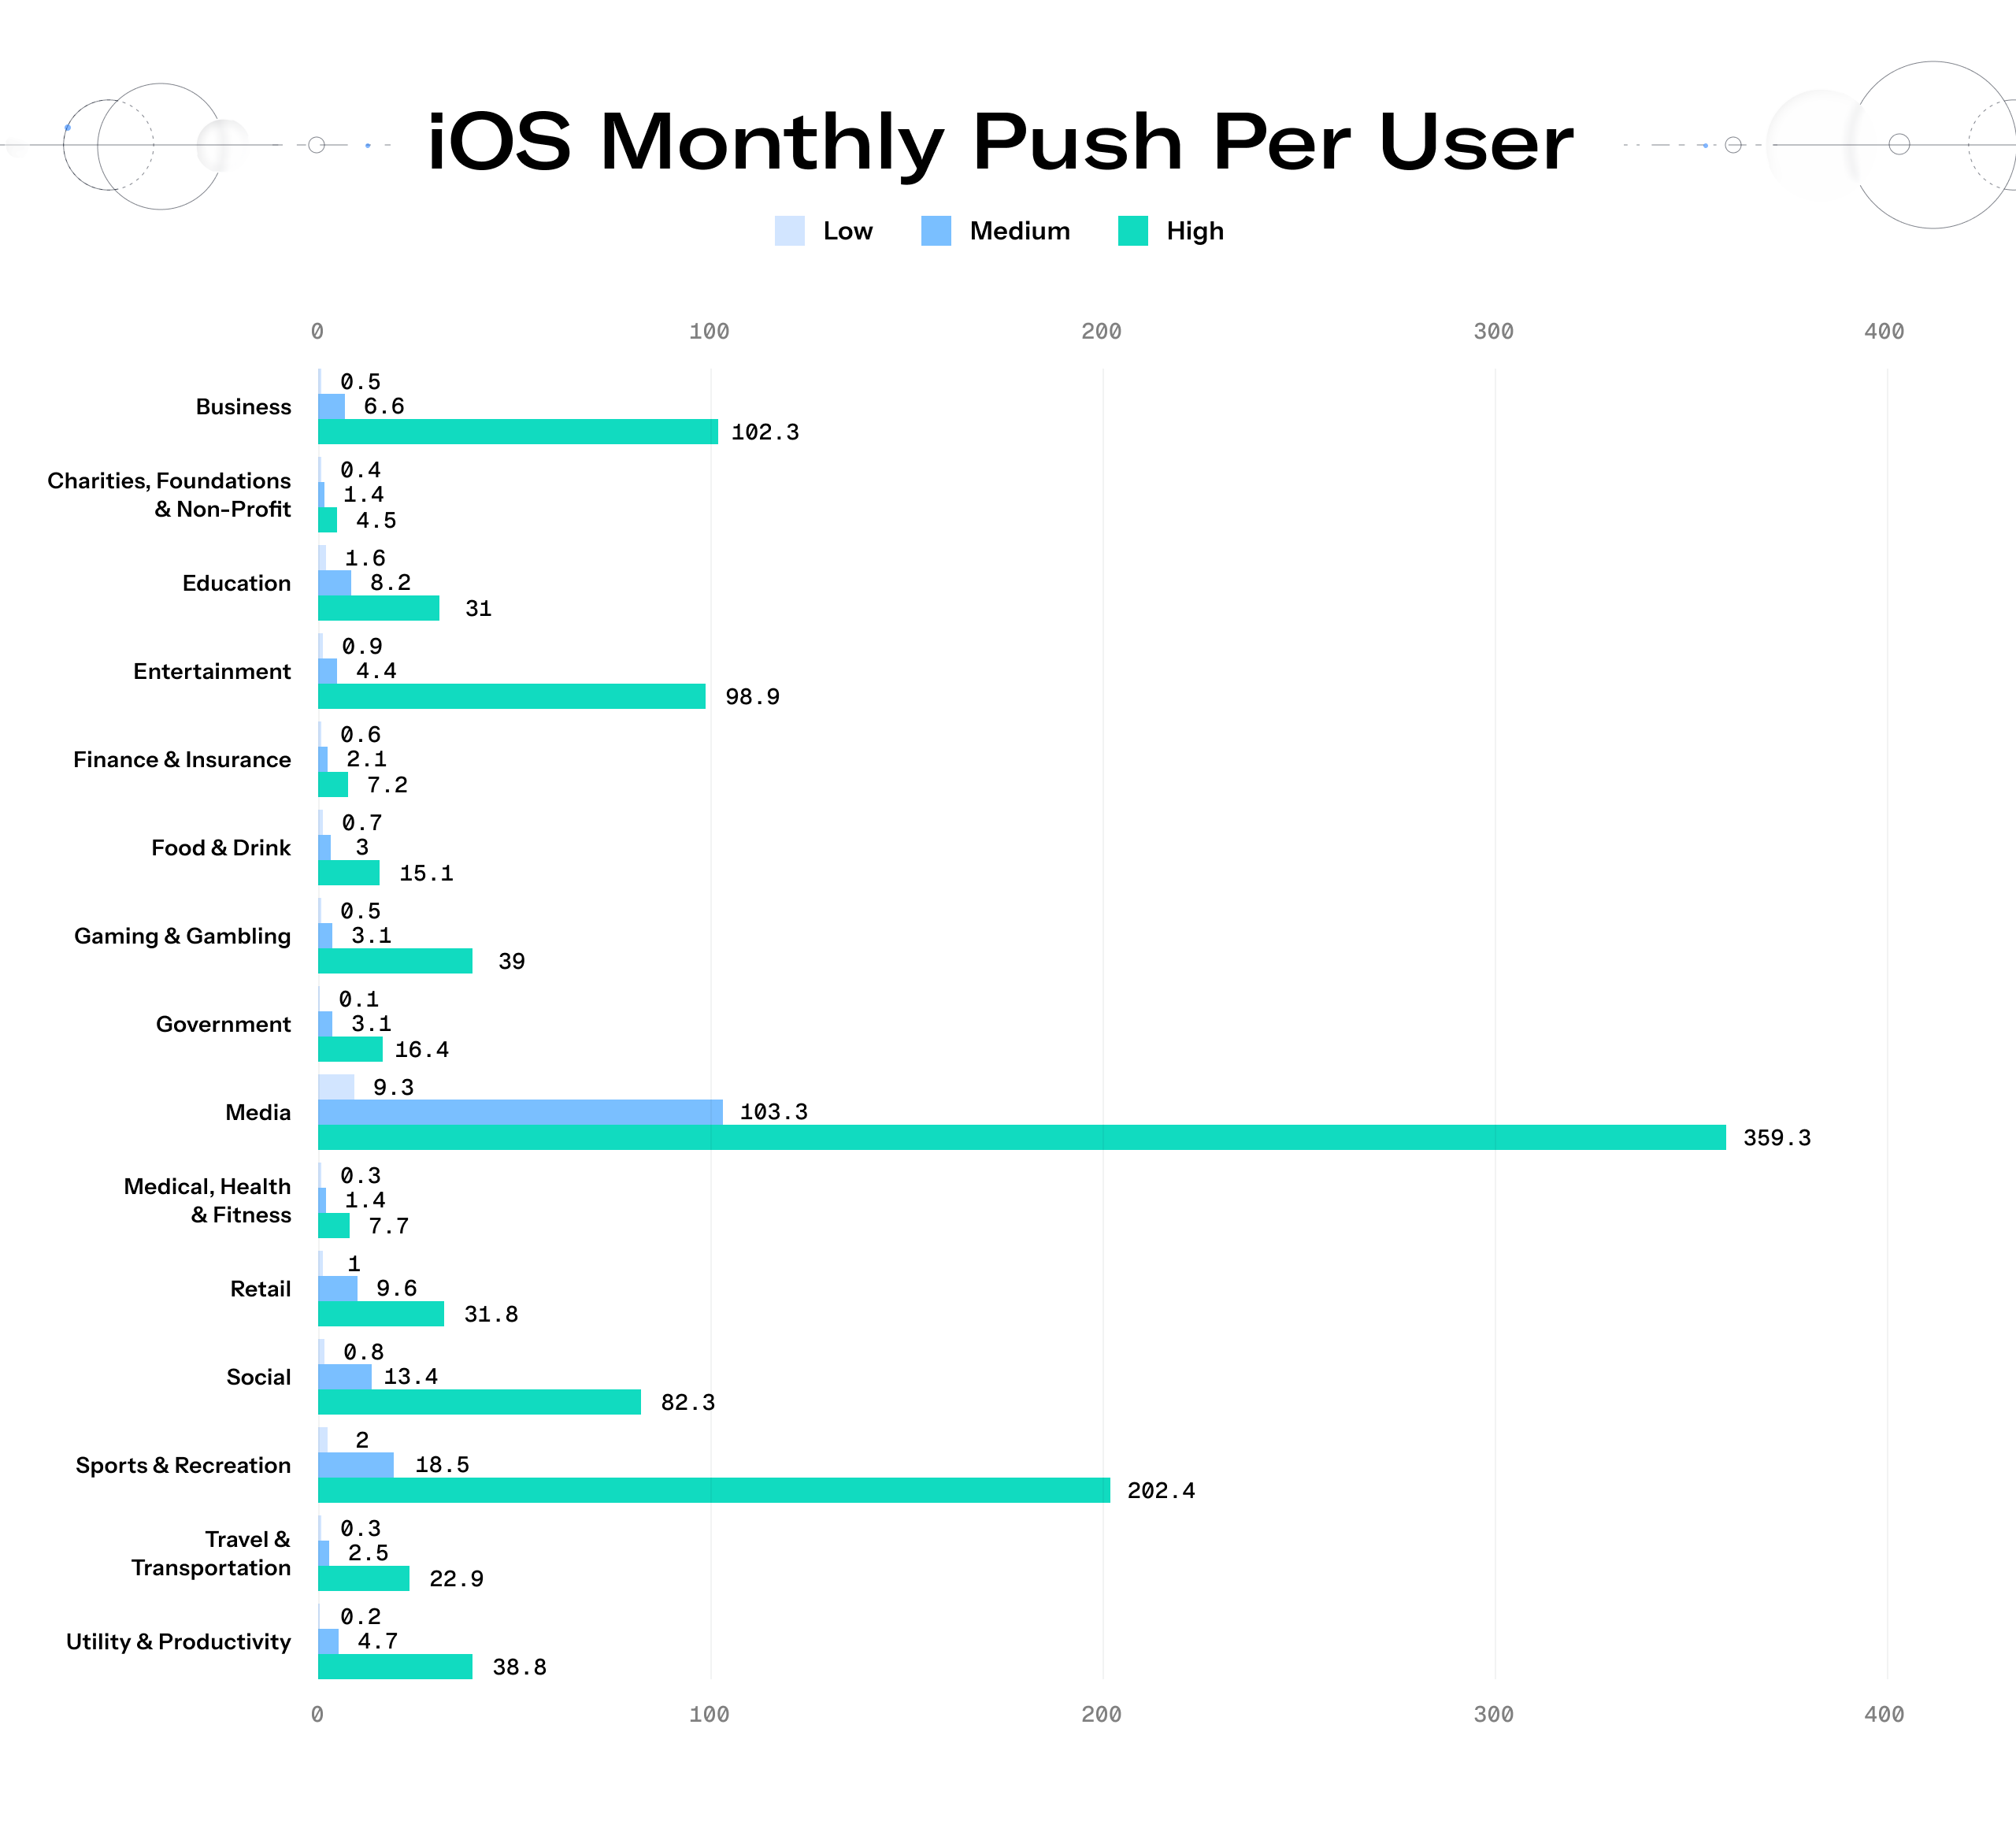
When your product is content, extreme high-frequency messaging is actually a competitive advantage. The Media vertical shatters the volume ceiling across both Android (360.3 pushes per user) and iOS (359.3 pushes per user) at the 90th percentile. This averages to more than ten notifications a day, a potentially catastrophic rate for a retail or utility app.
But when users opt into breaking news, live sports updates, or immediate entertainment drops, high frequency equals high value. When the content is hyper-relevant to the user’s immediate interests, this aggressive send approach works.
3. For high-trust verticals, restraint is a feature
Not every vertical needs to have high send volumes to succeed at mobile. In fact, the data reveals that for verticals managing sensitive information or civic duties, silence is a much more common strategy.
Government, Charities & Non-Profits, and Utility & Productivity apps maintain strict, low-volume baselines. On iOS, the Government vertical’s 10th percentile floor is nearly silent at just 0.1 pushes per user per month. These verticals focus on mission-critical, high-impact moments, proving that when a notification delivers undeniable value, you do not need to send it every day to retain a loyal user base.
Strategic considerations for push volume
1. Test relentlessly to maximize every send
A push notification is your one moment to capture your customers’ attention. You cannot afford to miss the mark and waste a touchpoint. That means rigorously testing message variants and send times against direct open rates and other key metrics, so you can identify exactly what impacts engagement. This allows you to achieve real results efficiently, without unnecessarily inflating your send volume.
2. Let your customers determine the frequency
Both Apple and Android are actively taking steps to give users more control over their push notifications. Instead of waiting for updates to roll out, start by creating a regular feedback loop to understand the exact content customers want, including where and when they want it.
Implementing tools like Surveys and Preference Centers to gather these message preferences is a critical step in advancing customers safely through the Activation and Engagement lifecycles.
3. Balance mobile app pushes with web notifications
The boundaries between mobile and web are blurring. With iOS mobile app push notifications now making their ways to Macs via iPhone Mirroring, now is an ideal time to evaluate how your mobile app and web notifications coordinate within your broader channel mix.
Consumers are already increasingly interacting with brands across these destinations. You must unify those experiences and balance your total volume to avoid overwhelming them across multiple screens.
Improving open rates with Airship: US Open

Methodology
Airship analyzed customer data in aggregate from January to December 2025 to identify apps with at least 1,000 active users that had sent at least 1,000 cumulative push notifications in one month. That group included more than 3 billion app users across thousands of apps and 15 industry verticals. All of our benchmarks are based on monthly calculations, averaged over 12 months.
About Airship
The pressures on brands to deliver exceptional customer experiences have never been higher. Today’s consumers demand frictionless, highly relevant, and hyper-personalized interactions — meaning the old playbook of rigid, “batch and blast” messaging is officially obsolete.
Airship is the only mobile-first customer experience platform built to deliver measurable business results at scale. Seventeen years ago, we pioneered the industry by delivering the world’s first push notification. Today, we continue to lead the market with industry-first AI agents and an agentic orchestration layer that automates the entire creation-to-optimization lifecycle. We empower product managers and marketers to build, approve, test, and iterate on rich, native customer experiences in minutes, not months.
We know that the smartphone is the remote control to your customer’s daily life. That is why we operate as a true extension of your team, helping you move past empty engagement metrics to deepen customer loyalty, scale your strategy, and meet your audience exactly where they convert.