You must add Custom and Predefined Events to your project before you can select them for Goals. You do not need to add Default Events to your project before selecting them for Goals.
## Creating Goals You can create up to 10 Goals per project. Follow these steps to create a new Goal: 1. Go to **Reports**, then **Goals** 1. Select **Create Goal**. 1. Configure fields: * Goal name — This name is used for identification in the list of all Goals in your project. * Description — This is additional information about the Goal. * Event — Search for and select an event. If the event does not have a category assigned, select from the list or select **Custom category** and enter a category name. 1. Select **Create Goal**. ## Viewing Goal reports After creating a Goal, view its performance reports to analyze engagement and measure success. Go to **Reports**, then **Goals**, and select the report icon ( ) for a Goal to open the reports:| Report name | Description |
|---|---|
| Goal | The number of times the event occurred per day and the 7-day average. |
| Channels per goal | The number of [Channels](https://www.airship.com/docs/reference/glossary/#channel_engage) that performed the event at least one time. You can filter by “greater than or equal to” and “is between” and enter values. |
| Goal frequency per channel | The frequency of event occurrence per [Channel](https://www.airship.com/docs/reference/glossary/#channel_engage). Data points displayed: 50th (median), 75th, and 99th percentiles. |
| Goals per platform | The percentage of events that occurred per platform. Only appears if multiple platforms are configured for the project. |
* TLS_CHACHA20_POLY1305_SHA256 * TLS_AES_256_GCM_SHA384 * TLS_AES_128_GCM_SHA256 * TLS_ECDHE_RSA_WITH_CHACHA20_POLY1305_SHA256 * TLS_ECDHE_RSA_WITH_AES_256_GCM_SHA384 * TLS_ECDHE_RSA_WITH_AES_128_GCM_SHA256 Some older HTTP libraries may not support this, but we have confirmed that the following work: * Java 1.6 or newer, but will require the JCE Unlimited Strength package appropriate for your java version from Oracle * Python 2.7.9 or newer * Python 3.4 or newer * Golang 1.5 or newer * NodeJS 0.10.33 or newer * Any HTTP library linked against OpenSSL 1.0.1f or newer (OpenSSL 1.0.1e-fips, which ships with Centos 6, also supports the needed ciphers) Why do I get an HTTP 402 error code when I try to issue a request to the Data Streaming API? : The number of simultaneous connections for a given connection point is restricted, and any connection attempt that exceeds that limit will receive an HTTP 402 error response. If this continues to occur after retrying for at least 30 seconds, please [contact Airship Support](https://support.airship.com/). # Activity log > The Activity Log is a unified list of your messaging activity from both the dashboard and the API. Unicast messages and messages created using Automation and Sequences are not included. Go to **Messages**, then **Activity Log**. By default, the activity log shows message activity for the last seven days, newest messages first. To change the viewable range, select **Last 7 Days**, and then select a new time period. To export data, click **Download CSV of Current View**. Export is limited to what appears in the displayed list. If **Show More** is present, select until the desired number of entries are listed. You can also access activity data using the API. See [Activity Log Report](https://www.airship.com/docs/developer/rest-api/ua/operations/reports/#getactivitylogreport) in the API reference. > **Note:** Unicast pushes are not included in the activity because they could theoretically make the log unmanageable. For example, a large app could send millions of unicast pushes in a single day, causing the activity log to be flooded with these messages and obscuring any other useful information. The following information is available in the activity log: | Data | Definition | | --- | --- | | **Message** | The name of the message. | | **Sent** | The date, time, and time zone when the message was sent. | | **Delivery Type** | *Experiments* are groups of messages that are part of an A/B Test. All other messages are *Engagement*. | | **Channels** | The channels selected for delivery. | | **Audience** | The audience selected for delivery. Click *Details* to see its value. | | **App Notification Sends** | The number of notifications containing user-alerting elements (text, badge, sound) sent to users opted in to push. | | **Direct App Opens** |
Each row represents a cohort of users that opened the app for the first time in the labeled week. The install count represents all the users that installed in the calendar week. | Use this Look to identify weeks that had higher or lower retention than normal. Day One retention is the percentage of people that opened the app the next day after install. Day One through Seven Retention, 7-14, and 14-30 are the percentage of people that opened the app anytime between that range from the install cohort. | | **Uninstalls by Install Date** | The rate of uninstall events by install day | Identify days in which more uninstalls occurred than normal. | | **Uninstalls by Install Week** | The rate of uninstall events by install week | Identify weeks in which more uninstalls occurred than normal. Keep in mind that since data is calculated at the week level, it can trickle in over time and update the rate. A user installing on 30 July will appear in the 24 July install week. If the user uninstalls on 5 August, that is still within a week, so the 00 Week Retention rate will be different on 3 August and on 6 August. | {class="table-col-1-20 table-col-2-40"} ## Device Properties Device Properties data provides information about your users' devices, e.g., Airship SDK version, app version, opt-in enabled/disabled, and other device-relevant metadata. Unless otherwise indicated, the data in each Look corresponds to the date range specified in *Filters*. Looks in the Device Properties default Dashboard: | Look | Definition | | --- | --- | | **Notification Opt-in Enabled Devices (All Time)** | The percentage of opted-in and opted-out devices, split by platform, and the total number of opted-in/out devices on your app
At the bottom of the Look are iOS Opt-In Benchmarks, which provide some guidance on industry standard opt-in/out rates, based on our benchmark studies. The Low, Medium, and High percentages indicate the 10th, 50th, and 90th percentiles, respectively, for your industry. | | **Notification Opt-in Enabled Devices (During Date Range)** | The percentage of users that have opted-in or out of push notifications during the specified date range | | **Background Enabled (During Date Range)** | The percentage of background-enabled devices | | **Location Enabled (During Date Range)** | The percentage of location-enabled devices | | **Time zones (Top 50) (During Date Range)** | The top 50 time zones among your users | | **Language Country (Top 50) (During Date Range)** | The top 50 country tags among your users | | **Language (Top 50) (During Date Range)** | The top 50 language tags among your users | | **iOS Model (Top 50) (During Date Range)** | The top iOS models among your users | | **[iOS or Android] Version (Top 50) (During Date Range)** | The most frequently installed versions among your users. | | **[iOS or Android] App Version (Top 50) (During Date Range)** | The most frequently installed app versions among your users | | **[iOS or Android] UA Version (During Date Range)** | The most frequently installed SDK versions among your users | {class="table-col-1-30"} For shared Looks, go to **Reports**, then **Performance Analytics**, then the folder icon (folder-simple), then **Shared**, then **Device Properties**. Shared Looks: | Look | Definition | | --- | --- | | **Device Tag Adds by User** | The number of [device tags](https://www.airship.com/docs/reference/glossary/#device_properties) added by [Channel ID](https://www.airship.com/docs/reference/glossary/#channel_id) during the filtered time range | | **Opted in Status by Day** | The number of channels with opted-in push notifications per mobile platform over the last 30 days | | **Opted in Status by Week** | The evolution of opted-in and opted-out users by week for the last three months | | **Web Audience by Browser Type** | The number of opted-in channels per browser type (desktop or mobile) | ## Email See [Email in Performance Analytics](https://www.airship.com/docs/guides/reports/analytics/email/). ## Labs The Labs Dashboard provides early access to Dashboards and Looks Airship is evaluating to enhance your reporting experience. You can provide feedback using the survey link on the page. To show or hide Labs in Performance Analytics, a user with [Owner, Administrator, or Full Access permission](https://www.airship.com/docs/guides/getting-started/admin/teams-messaging/#access-levels) must toggle the option in your project settings: 1. Next to your project name, select the dropdown menu (▼), then **Settings**. 1. Under **Project settings**, select **Dashboard Settings**. 1. Select the toggle for **Labs Dashboard**. > **Important:** Airship Labs analytics dashboards and reports are provided as is. Please note: > * Features may contain bugs or reliability issues. > * Reports, dashboards, and underlying data may change without notice. > * Changes could impact any custom reports you build. > * Features may be modified or removed entirely. > > Use of Pilot features is governed by the [Airship Beta Services Terms](https://www.airship.com/legal/beta-terms). Looks are provided under topical headings. Select the link under each Look to access a Dashboard containing additional related Looks. Some dashboards can be filtered by Reachable [Contact](https://www.airship.com/docs/reference/glossary/#contact) and Reachable [Channel (Development)](https://www.airship.com/docs/reference/glossary/#channel_dev). *Reachable* means the user has an identifier for one or more channels configured for your Airship project that can receive messages. Users can receive messages on any [Channel (Engagement)](https://www.airship.com/docs/reference/glossary/#channel_engage) where their channel is opted in, and those that do not require opting in. Their email channels must not be suppressed. For example, if: * a Contact has app, email, and SMS channels that are all opted out, and * your project is configured for the same engagement channels and sends push, Message Center, email, and SMS messages, then the Contact's channels' reachable statuses are: * App: Reachable, because Message Center doesn't require opting in * Email: Reachable, because transactional email doesn't require opting in * SMS: Unreachable, because SMS requires opting in and the channel is opted out ## Lifecycle The Lifecycle Dashboard displays the user count for each Active Users Look. Line graphs show user counts over time and broken down by platform. View trends of new users and app uninstalls. Looks in the Lifecycle default Dashboard: | Look | Definition | | --- | --- | | **Daily Active Users** | The number of unique users that opened your app in the last one day, not including today. | | **Weekly Active Users** | The number of unique users that opened your app in the last seven days, not including today. | | **Monthly Active Users** | The number of unique users that opened your app in the last 30 days, not including today. | | **New Users** | Daily count of new users that opened the app for the first time, broken down by platform along with the total. | | **Uninstall** | The number of uninstalls for each day. Uninstall information is only available for users you have sent a notification to. | | **Daily Active User Trend** | Daily count of users that opened the app, broken down by platform along with the total. | | **Sessions** | Daily count of the number of times the app was opened. | | **Session duration by day of week** | User session durations by day of week, split by platform, in the last seven days. | | **User Session Duration** | The distribution of user session durations in minutes for the given time range. In the [Explore view](https://www.airship.com/docs/guides/reports/analytics/exploring/#the-explore-view), filter by a specific push ID or slice by tags. | For shared Looks, go to **Reports**, then **Performance Analytics**, then the folder icon (folder-simple), then **Shared**, then **Lifecycle**. These Looks are available for projects using the US cloud site only. Shared Looks: | Look | Definition | | --- | --- | | **Average Message Count Prior to Uninstall** | Average count of messages received for users prior to an uninstall event. | | **Average Open Count** | Average Open count for users installing and uninstalling within retention window and have had the app installed for at least one day. | | **Decay Uninstalls** | The number of uninstall events due to user inactivity. | | **Message Count prior to an Uninstall** | The number of messages received per user who uninstalled within a time frame. | | **New Users by Day and Opt In Status** | List of new users, split by opt-in status. | | **Top Messages before an Uninstall** | Top messages by user count. We look at a user's uninstall timestamp, then look backward to rank their messages within a window, with 1 being the most recent. | | **Uninstalled Users Lifetime Averages** | The average number of days a user is active based on uninstall data and the average number of messages sent to users. | | **Uninstalls per App** | Count the number of uninstall events due to user inactivity for all the apps you have access to. | | **Uninstalls vs Installs** | List of new users (installs) and uninstalls. Uninstalls are received after sending a notification to a user that has either deleted your app or opted out of web notifications and never returned to your site. | ## Location Location data help you understand where your active users are, as well as their behaviors. * The User Locations Look is based on automatic location events via a device's GPS. The remaining Looks are based on usage of our Region framework via Gimbal and other beacon providers. See [Gimbal integration](https://www.airship.com/docs/integrations/gimbal/). * Region data exists as Arrival or Departure records triggered by entering or exiting a region. A region is defined by either a geofence or beacon. * The Date Range filter refers to the date range of region activity. The Recent Activity Window will always extend the appropriate number of hours prior to the date range. See also [Exploring Region Events](https://www.airship.com/docs/guides/reports/analytics/exploring/exploring/#exploring-region-events) Looks in the Location default Dashboard: | Look | Description | | --- | --- | | **User Locations** | Your users' locations within the last whole day are represented in a heat map. See the legend in the lower left corner for numeric values. Drag and zoom to concentrate the view on a specific region. | | **Total Arrivals** | The number of times users triggered a geofence or beacon by entering a region during the selected date range. | | **Unique Users** | The number of unique users that triggered a geofence or beacon during the selected date range. | | **Average Dwell Time (min)** | The average dwell time in minutes of a user while in a geofence or the vicinity of a beacon during the selected date range.
The dwell time within a region is derived by matching an Arrival to a Departure. Records are matched for a user if they are consecutive actions within the same region within twelve hours. Unmatched records are not included in dwell time calculations. | | **Arrivals by Hour** | A line graph of the number of Arrivals per hour for the last seven days by platform. | | **Top 15 Regions by Total Arrivals** | A bar chart of Arrivals and Distinct Users for the top 15 regions by overall Arrival count. | | **Unique Regions Encountered per User** | The distribution of users by the number of distinct regions they encountered. | | **Region Dwell Time in Minutes** | The distributions of dwell time for all visits. | {class="table-col-1-30"} ## Messages The Messages Dashboard contains data about your messaging over the last seven days. You can change the date range filter in the [Explore view](https://www.airship.com/docs/guides/reports/analytics/exploring/exploring/#the-explore-view). Looks in the Messages default Dashboard: | Look | Description | | --- | --- | | **Messages** | All Scheduled Messages and A/B Test notifications from the last seven complete days, along with the Delivery/Display Counts, Direct Response Metrics, Indirect Response Metrics, and Opt Out Metrics for each. Message types included are Push Notifications, Web Notifications, Message Center Deliveries, and In-App Impressions. Opt Out events are attributed to a notification if they occur within one hour of delivery. | | **Automations in Date Range** | All deliveries for your Automated Pipelines within the last seven complete days, along with the Delivery/Display Counts, Direct Response Metrics, Indirect Response Metrics, and Opt Out Metrics for each. Message types included are Push Notifications, Web Notifications, Message Center Deliveries, and In-App Impressions. Opt Out events are attributed to a notification if they occur within one hour of delivery. | For shared Looks, go to **Reports**, then **Performance Analytics**, then the folder icon (folder-simple), then **Shared**, then **Messages**. Shared Looks: | Look | Description | | --- | --- | | **A/B Test: Indirect Opens for Control-Variant** | Summary of the Control/Variant Test. Here we compare unique indirect user opens for the Control to each variant. Direct opens are not included for the control group since they do not receive a notification. | | **A/B Test: Indirect Opens for Variants** | Count of indirect opens for each variants of the A/B test. | | **Campaigns** | Aggregate performance of all messages (including unicast) based on campaign categories. | | **Direct Open Rates by Week** | Direct open rates by week and platform. | | **E-Mail Report** | E-mail message performance over the past 60 days, per campaign category. | | **Live Activity Messages** | Live Activity message performance report, detailed per Live Activity name. | | **Message Center Deliveries** | Message Center performance report, detailed per message content. | | **Message Report by Platform** | Recreation of the main messaging report but at a user-level Look, so the message can be broken out by platform. | | **Message Report by Scheduled Time** | Message report detailed per scheduled time. By default, this Look includes the following message types: push notification, Message Center, web notification, in-app message. | | **Message Sent Count for Last 7 Days** | Line graph of message sent count for the last seven days. Includes unicast messages. | | **Non-Alerting Sends** | The number of messages delivered with alerting and the number of messages delivered silently, over the past seven days. | | **Opens by Push ID** | Count of user opens before and after receiving a message. To see the count, select the gear icon (⚙) then select **Explore from here**, enter or select a Push ID in the **Opens By Push - Push ID** filter, then select **Run**. | | **Retargeting Table** | The number of messages delivered, per push ID, over the past seven days. | | **Unicast Messaging** | Message performance for transactional messages where the message is addressed to a single device. | ## Overview The Overview Dashboard provides a user count in each Look. Use them to understand active users and high-level message metrics. Looks in the Overview default Dashboard: | Look | Description | | --- | --- | | **Daily Active Users** | The number of unique users that opened your app in the last one day, not including today. | | **Weekly Active Users** | The number of unique users that opened your app in the last seven days, not including today. | | **Monthly Active Users** | The number of unique users that opened your app in the last 30 days, not including today. | | **Users inactive in the last day** | The number of unique users that were not active one day ago but were active in the six days prior. | | **Users inactive in the last 7 days** | The number of unique users that were not active in the last seven days but were active in the 14 days prior. | | **Users inactive in the last 30 days** | The number of unique users that were not active in the last 30 days but were active in the 30 days prior. | | **Authenticated Users** | The number of users that opened your app with a [Named User](https://www.airship.com/docs/reference/glossary/#named_user) that had been set for them previously. | For shared Looks, go to **Reports**, then **Performance Analytics**, then the folder icon (folder-simple), then **Shared**, then **Overview**. Shared Looks: | Look | Description | | --- | --- | | **Active Users by Date** | Active users based on app opens over time. | | **Active Users by Month** | Active users based on app opens by month. | | **Active Users by Week by Platform** | Active users based on app opens by week, split by platform. | | **App Sessions** | The number of app sessions over the last complete day that has just passed. In other words, the previous day. | | **Growth by Day** | Counts by day of users installing, uninstalling, churning, and reactivating. Typically run for a seven-day period. | | **Opens by Hour (Time zone shifted)** | The number of app opens by hour of day over the last 60 days. | | **User Count by Platform** | Timeline of user count by day by platform. | | **User with a Direct or Indirect Open** | Count of distinct users with either a direct or indirect open with a time frame. | | **Web Events** | The number of first open, web click, and web session events that occurred over the last seven days. | ## Predictive The Predictive Dashboard is a view into [Predictive Churn](https://www.airship.com/docs/reference/glossary/#predicted_to_churn) risk groups, distribution of users across and opt-in rates within the risk groups, as well as the performance of churn mitigation. Predictive tags are added on Sundays, and the Looks default to the most recent Sunday. Looks in the Predictive default Dashboard: | Look | Description | | --- | --- | | **Low Churn Risk Users** | Users least likely to become inactive in the next 30 days. | | **Medium Churn Risk Users** | Users who exhibit signs of potentially becoming inactive in the next 30 days. | | **High Churn Risk Users** | Users most likely to become inactive in the next 30 days. | | **Risk Distribution** | Percentage breakdown of Low, Medium, and High Risk users based on the last prediction in the time frame (date in center). Click to drill down to a view where you can identify users' [Channel IDs](https://www.airship.com/docs/reference/glossary/#channel_id). | | **Top 25 Device Tags by Risk Distribution** | List the top 25 device tags by High Risk user count split by predictive churn risk category. | | **Average Sends per Weekly Churn Transition** | The average number of messages sent to each user in a one week period, based on the users' transition between churn risk categories. This can help you understand how message frequency correlates to users in the low risk category. | | **Historical Predictive Churn Outcome** | A historical view of the performance of churn prediction. The left side shows the predictions that occurred four weeks prior to the date selected in the Date Range filter. On the right side are the categories of those same users at the end of the fourth week.
If you are not taking action on your highest risk users, a majority of them will become inactive. This Look gives you an easy way to see what happened to those users and can give you confidence that our model is performing well or that your actions have caused High and Medium Risk users to move into the Low Risk category. You must have at least five weeks of churn analysis for this Look to populate. | {class="table-col-1-30"} For shared Looks, go to **Reports**, then **Performance Analytics**, then the folder icon (folder-simple), then **Shared**, then **Predictive**. Shared Looks: | Look | Description | | --- | --- | | **All Device Tags by Risk Distribution** | Device tags correlated with low, medium, and high risk to churn users. | | **Automations based on Tag Adds** | Push automation sent over the past seven days, triggered by adding the predictive churn tag. | | **High Churn Risks Users & Events** | High Churn Risk, Opted-In Users and their Ending Tag, broken up by the number of events each cohort had. So you can see the correlated events between churn tag transitions. | | **Optimal Send Time** | Analysis of the [Optimal Send Time](https://www.airship.com/docs/reference/glossary/#optimal_send_time) by hour of day. | | **Percentage Change by Tag Week over Week** | The change in risk categories by week for the last 30 days. | | **Predictive Churn by Best Hour** | Predictive churn by hour of day. | | **Predictive Tag Changes in the Last Week** | Predictive tag adds/deletes in the last week. This does not include users who continue to have the same tag. | ## Profile The Profile Dashboard displays current tag counts. Looks in the Profile default Dashboard: | Look | Description | | --- | --- | | **Top 50 Device Tags Added (During Date Range)** | The top 50 tags that users added over the specified date range. The date range defaults to the past seven days. | | **Top 50 Device Tags (All Time)** | The top tags among your devices. The tag counts are partitioned by opt-in status. In the [Explore view](https://www.airship.com/docs/guides/reports/analytics/exploring/#the-explore-view), splice the tags by tag group, opt-in status, or specific device properties. | For shared Looks, go to **Reports**, then **Performance Analytics**, then the folder icon (folder-simple), then **Shared**, then **Profile**. Shared Looks: | Look | Description | | --- | --- | | **User Platform Groups** | The distribution of [Named User](https://www.airship.com/docs/reference/glossary/#named_user) values across App and Web. Use this Look to see if your users are App Only, Web Only, or App and Web. | | **User Tag List** | Find users with the same combination of tags. To find the users, select the gear icon (⚙) then select **Explore from here**, configure the **Tags Current — Tag List** filter with your desired tag data, then select **Run**. | ## Revenue The Revenue Dashboard helps you understand key performance indicators associated with revenue generation or related events. The default Dashboard is customized based on the industry type set [when creating a project](https://www.airship.com/docs/guides/getting-started/setup/#create-a-messaging-project). Looks in the Revenue default Dashboard: | Look | Description | | --- | --- | | **Total Purchase/Shared Value** | Sum of all event values for Purchase or Shared over the given time range. | | **Purchase/Shared Value per User** | Total Purchase or Shared Value divided by the number of distinct users. | | **Retail/Content Funnel** | Users that followed the Retail or Content funnel path over the date range selected. See the [list of Supported Funnels](#supported-funnels) below | | **Custom Events Table** | All [Custom Events](https://www.airship.com/docs/reference/glossary/#custom_event) that occurred in the given time range. | For shared Looks, go to **Reports**, then **Performance Analytics**, then the folder icon (folder-simple), then **Shared**, then **Revenue**. Revenue contains a single shared Look, Custom Events by Attributed Push, which displays [Custom Event](https://www.airship.com/docs/reference/glossary/#custom_event) counts by attributed push ID/message. Use this Look to see which message, if any, directly or indirectly triggered a Custom Event, and also the subsequent events. ### Supported Funnels These funnels are supported for the Retail/Content Funnel Look in the [Revenue Dashboard](#revenue): Media : `browsed_content » consumed_content » shared_content` Retail : `browsed » added_to_cart » purchased` Travel & Transportation : `browsed » added_to_cart » purchased` Total Revenue : All purchase revenue over the date range. Revenue per user : Average purchase revenue per customer that purchased. Retail Funnel : The total value for the browsed, added_to_cart and purchased event. Retail Funnel Counts : The total number of times users browsed, added_to_cart and purchased. ## Send Frequency The Send Frequency Dashboard contains Looks for send volume and frequency for the App channel. Looks are grouped under section headings that explain their use: * [Engagement by Send Volume](#engagement-by-send-volume) * [Engagement by Send Frequency for a Given Send Volume](#engagement-by-send-frequency-for-a-given-send-volume) * [Week Over Week Comparisons](#week-over-week-comparisons) * [The Messages You Sent Within the Last Week](#the-messages-you-sent-within-the-last-week) Use the filters at the top of the Dashboard to adjust weeks to analyze, send volume, and platforms. Weeks run Sunday to Saturday, UTC. Some Performance Analytics data is updated daily, but the Send Frequency Analytics Dashboard reports weekly snapshots of engagement metrics, so some mismatch in metrics are expected. [Tutorial: Interpreting the Send Frequency Dashboard](https://airship.wistia.com/medias/56a1keoib8) ### Engagement by Send Volume Engagement by Send Volume reports on the number of messages you sent last week. You can analyze the impact different send volumes had on user behavior. Analyze the impact of send volume on direct open rates, uninstalls, and opt-out rates. For a different week, use the **Engagement Week to Analyze** filter. Use the **Send Volume Range Filter** to zoom in on a range of send volumes. Looks in the Engagement by Send Volume section: | Look | Description | | --- | --- | | **User Count by Send Volume** | The weekly number of distinct user counts within the corresponding send volume group, broken down by platform. | | **Direct Open Rate by Send Volume** | The weekly average direct open rates of the users within the corresponding send volume group, broken down by platform. | | **Uninstall Rate by Send Volume** | The weekly uninstall rates of the users within the corresponding send volume group, broken down by platform. | | **Opt-out Rate by Send Volume** | The weekly opt-out rates of the users within the corresponding send volume group, broken down by platform. | ### Engagement by Send Frequency for a Given Send Volume Engagement by Send Frequency for a Given Send Volume helps you understand the impact frequency of messaging has on important metrics. For a different week, use the **Engagement Week to Analyze** filter. The **Send Volume to Analyze** filter default value is 4. Looks in the Engagement by Send Frequency for a Given Send Volume section: | Look | Description | | --- | --- | | **User Count by Send Frequency** | The weekly number of distinct user counts within the corresponding send frequency group for a given send volume, broken down by platform. | | **Direct Open Rate by Send Frequency** | The weekly average direct open rates of the users within the corresponding send frequency group for a given send volume, broken down by platform. | | **Uninstall Rate by Send Frequency** | The weekly uninstall rates of the users within the corresponding send frequency group for a given send volume, broken down by platform. | | **Opt-out Rate by Send Frequency** | The weekly opt-out rates of the users within the corresponding send frequency group for a given send volume, broken down by platform. | ### Week Over Week Comparisons Week Over Week Comparisons help you understand how your send volume changes week over week. There are Android and iOS versions of each Look. Use the **Send Volume Range** filter to zoom in on a range of send volumes. The **Weeks to Analyze** filter default value is 2. | Look | Description | | --- | --- | | **Send Volume** | The weekly number of distinct user counts within the corresponding send volume group, broken down by date. | | **Direct Open Rate** | The weekly average direct open rates of the users within the corresponding send volume group, broken down by date. | | **Uninstall Rate** | Shows the weekly uninstall rates of the users within the corresponding send volume group, broken down by date. | | **Opt-out Rate** | The weekly opt-out rates of the users within the corresponding send volume group, broken down by date. | ### The Messages You Sent Within the Last Week The Messages You Sent Within the Last Week section contains a single Look, Push Details, which displays information about messages sent within the last week: * Notification ID * Notification Date * Message * Campaign Category * Total Send Count * Direct Open User Count * Direct Open User Rate The default time frame is messages sent in the last week. For a different week, use the **Engagement Week to Analyze** filter. ## Subscription Lists For shared Looks, go to **Reports**, then **Performance Analytics**, then the folder icon (folder-simple), then **Shared**, then **Subscription Lists**. Two Dashboards contain multiple Looks. The App and Web Subscription Lists Dashboard is a global overview of the number of users who subscribed to your [Subscription Lists](https://www.airship.com/docs/reference/glossary/#subscription_list). Looks in the App and Web Subscription Lists shared Dashboard: | Look | Description | | --- | --- | | **Currently Eligible Subscribers** | The count of current eligible subscribers to the list or lists selected by the List Filter. Eligible subscribers are opted-in to push notifications. | | **Current Subscribers** | The count of current subscribers to the list or lists selected by the List Filter. Subscribers may or may not be opted-in to push notifications. | | **Current Opt-in Audience** | The count of App and Web users in your audience that are opted-in to push notifications. | | **Average Weeks Eligible** | The average number of weeks current eligible subscribers have been eligible. The lists included are those selected by the List Filter. | | **Current Subscriber Opt-in Status** | The count of current subscribers to the list or lists selected by the List Filter and their opted-in to push notifications status. | | **Currently Eligible Subscribers by List** | The number of eligible users per subscription lists. | | **Total Current Audience** | The count of App and Web users in your audience. This includes users who are opted-in and opted-out of push notifications. | | **Current Audience Opt-in Status** | The count of App and Web users in your audience and their opted-in to push notifications status. | | **Current Audience Opt-in by Platform** | Your audience by platform and their opted-in to push notifications status. | | **Opt-in Status Over Time** | Count of opted-in and opted-out users. | | **Eligible Audience Over Time** | Eligible audience members are opted-in to notifications and subscribed to the list. | | **Average Weeks Eligible** | The average number of weeks that users have been eligible for notifications (opted-in to messages and subscribed to the list). | The Subscription Lists dashboard shows the number of users engaged by [Subscription List](https://www.airship.com/docs/reference/glossary/#subscription_list). Looks in the Subscription Lists shared Dashboard: | Look | Description | | --- | --- | | **Current Subscriber Counts** | The counts of current total subscribers and eligible subscribers. Eligible subscribers are opted-in to push notifications. Filters applied: List Filter, Platform Filter, Email Opt-in Type Selection. | | **Current Subscriber Counts by Platform** | The counts of current total subscribers and eligible subscribers, by device platform. Eligible subscribers are opted-in to push notifications. Filters applied: List Filter, Platform Filter, Email Opt-in Type Selection. | | **Eligible Audience Over Time** | Eligible audience members are opted-in to notifications and subscribed to the list. Filters applied: List Filter, Report over time filters, Platform Filter, Email Opt-in Type Selection. | | **Unsubscribes from List** | Counts of eligible users that unsubscribed from the list during the report time frame. Filters applied: List Filter, Report over time filters, Platform Filter, Email Opt-in Type Selection. | | **Average Weeks Eligible** | The average number of weeks current eligible subscribers have been eligible. Filters applied: List Filter, Platform Filter, Email Opt-in Type Selection. | | **Email Domain Breakdown** | Counts of current eligible email users per domain. Filters applied: List Filter, Email Opt-in Type Selection. Applies to Email only. If the user is opted in by default, as with transactional messages, then the email domain is not available. | # Email in Performance Analytics > Use Performance Analytics to track the health of your email audience and performance. You can view information about your email messaging in Dashboards, Looks, and the Engagement [Explore](https://www.airship.com/docs/reference/glossary/#pa_explore). ## Dashboards and Looks You can access multiple Dashboards and a standalone Look in the Shared folder. Go to **Reports**, then **Performance Analytics**, then the folder icon (folder-simple), then **Shared**, then **Email**. The standalone look, Campaign Activity Report, displays raw data, including sends, opens, clicks, and bounce metrics for your campaigns over the last seven days. Shared Dashboards: | Dashboard | Description | | --- | --- | | **Customer Email Activity (Last 30 days)** | All email events that occurred over the past 30 days. This includes all the email send events and custom events that occurred over this period, detailed per day. | | **Email Campaign Level Dashboard** | Message performance by [Campaign Category](https://www.airship.com/docs/reference/glossary/#campaign_categories). Only email messages with a set campaign category appear on this Dashboard.
This Dashboard can show you which of your campaigns have been most and least successful, helping you improve messaging and engagement in the future. Select **Filters** to filter by campaign. | | **Email Deliverability Dashboard** | Recent deliverability rates: opens, clicks, bounces, unsubscribes, and spam complaints.
This Dashboard reports metrics by domain, which can help you pinpoint deliverability issues with your various email domains. High or increasing open and click rates may indicate high quality messages and an engaged audience, and a sudden, dramatic drop can indicate deliverability issues. Declining or steadily-low bounce, unsubscribe, and spam complaint rates indicate healthy deliverability. If these rates increase, you should investigate a deliverability issue with your email domain. | | **Email Main Aggregate Dashboard** | General information about your email project over the last seven days. **Aggregate Metrics - Last 7 Days** shows various rates compared to total message sends over the last seven days with an activity trend over a monthly period. **Activity Over Time** is broken down by sent count, unique open rate, unsubscribe rate, and hard bounce rate. **Alerts** shows the percentage change in different alerts, comparing the seven-day rate to the previous 90-day rate. **Campaign Alerts** shows the percentage change in different alerts for each campaign, comparing the seven-day rate to the previous 90-day rate. Also includes **Recent Campaigns** information. | {class="table-col-1-30"} ## Engagement Explore Use the Engagement [Explore](https://www.airship.com/docs/reference/glossary/#pa_explore) to analyze the performance of your campaigns. Data returned is at the user level. First, open the Explore: 1. Go to **Reports**, then **Performance Analytics**. 1. Select the folder icon (folder-simple), then **Shared**. 1. Under **Looks**, select **Explore Glossary** (**Explore Glossary EUCS** for EU customers). 1. Select **Engagement**, then **Navigate to Explore**. Next, add [Dimensions](https://www.airship.com/docs/reference/glossary/#pa_dimension) and [Measures](https://www.airship.com/docs/reference/glossary/#pa_measure) to your query. Email-related Dimensions and Measures are listed in the next sections. For additional usage information, see [Exploring Performance Analytics data](https://www.airship.com/docs/guides/reports/analytics/exploring/exploring/). > **Note:** When exploring data, **E-mail Metrics - Device Properties** Dimensions and Measures cannot be combined with **Email Metrics** Measures. ### General data Get general counts and information about your email messaging. After opening the Engagement Explore: 1. In the sidebar, select **Message Metrics**. 1. Under **Dimensions**, select **Email**, then select any of the following: * Bounce (Yes / No) * Bounce Category * Bounce Reason Name * Click (Yes / No) * Click Count * Delivered (Yes / No) * Email Address * Link Name * Link URL * Open (Yes / No) * Open Count * Spam Complaint (Yes / No) * Unsubscribe (Yes / No) * Unsubscribe Event Type ### Device-specific data Get device-specific data captured through email engagement events `click`, `open`, and `initial_open`. These provide valuable insights into your engaged audience, including Is Mobile, which indicates if the email was opened or clicked from a mobile device, and Is Prefetched, which can be used to determine if the open event came from an Apple prefetch or Gmail prefetch. 1. In the sidebar, select **Message Metrics**. 1. Under **Dimensions**, select **E-mail Metrics - Device Properties**, then select any of the following: | Dimension | Description | | --- | --- | | **Agent Family** | Agent or client type based on user agent | | **Device Brand** | Device Manufacturer based on user agent | | **Is Mobile** | Indicates if this was a mobile device | | **Is Prefetched** | Indicates if the event was likely a machine-driven engagement, for example through Apple Mail Privacy Protection or Gmail Prefetch | | **OS Family** | Operating system based on user agent | | **OS Version** | Operating system version based on user agent | ### Post-send event data Get raw counts and rates (as percentage of total email sends) of post-send email events. You can use these to measure performance of your messages in terms of deliverability and engagement. 1. In the sidebar, select **Message Metrics**. 1. Under **Measures**, select **E-mail Metrics**, then select any of the following: * Bounce Count * Bounce Rate * Click to Open Rate * Delivery Count * Delivery Rate * Hard Bounce Count * Hard Bounce Rate * Link Unsubscribe Count * Link Unsubscribe Rate * List Unsubscribe Count * List Unsubscribe Rate * Soft Bounce Count * Soft Bounce Rate * Spam Complaint Count * Spam Complaint Rate * Total Click Rate * Total Clicks * Total Open Rate * Total Opens * Unique Click Count * Unique Click Rate * Unique Open Count * Unique Open Rate * Unsubscribe Count * Unsubscribe Rate ### Engagement event data Get raw counts of email engagement events. Use these to measure performance of your messages by device type. 1. In the sidebar, select **Message Metrics**. 1. Under **Measures**, select **E-mail Metrics - Device Properties**, then select any of the following: | Measure | Description | | --- | --- | | **Total Clicks** | Total number of email recipient clicks of a tracked link in the message | | **Total Full Opens** | Total numbers of email recipients that opened a message in a mail client, rendering a tracking pixel at the bottom of the message | | **Unique Clicks** | Unique number of email recipient clicks of a tracked link in the message | | **Unique Full Opens** | Unique numbers of email recipients that opened a message in a mail client, rendering a tracking pixel at the bottom of the message | # SMS in Performance Analytics > Learn how to access SMS data in Performance Analytics. Your SMS data is available within a few [Explores](https://www.airship.com/docs/reference/glossary/#pa_explore): * Engagement * SMS Mobile Originated * Custom Events After opening each explore, you can add SMS data to your query using the [Dimensions](https://www.airship.com/docs/reference/glossary/#pa_dimension) and [Measures](https://www.airship.com/docs/reference/glossary/#pa_measure) listed in each sections. For additional usage information, see [Exploring Performance Analytics data](https://www.airship.com/docs/guides/reports/analytics/exploring/exploring/). ## Engagement Explore Use the Engagement Explore to analyze the performance of your campaigns. Data returned is at the user level. First, open the Explore: 1. Go to **Reports**, then **Performance Analytics**. 1. Select the folder icon (folder-simple), then **Shared**. 1. Under **Looks**, select **Explore Glossary** (**Explore Glossary EUCS** for EU customers). 1. Select **Engagement**, then **Navigate to Explore**. Next, add Dimensions and Measures to your query for the following information: * [Delivery data](#delivery-data) * [Short link clicks](#short-link-clicks) * [Opt-in/out data](#opt-inout-data) ### Delivery data Get raw counts and rates (as percentage of total SMS sends) of message delivery events. These can help you determine your real message audience by determining how many of your messages were `delivered` as opposed to `aborted`, etc. After opening the Engagement Explore: 1. In the sidebar, select **Message Delivery**. 1. Under **Dimensions**, select **SMS Deliveries**, then select any of the following: * Delivery Address (MSISDN) * MMS Send (Yes / No) * Sender * Vendor * Is RCS (Yes / No) ### Short link clicks Get counts of short link clicks. Use these to determine the number of unique recipients who engaged with your messages. You can use these counts as measures of how successful your sends are. After opening the Engagement Explore: 1. In the sidebar, select **Message Metrics**. 1. Under **Measures** select **SMS Metrics**, then select any of the following: * SMS Short Link Click Count * SMS Short Link Click Named User Count * SMS Short Link Click User Count * RCS Read Count ### Opt-in/out data Get raw counts and rates (as percentage of total SMS sends) of message delivery events. Use these Measures to see the changes in your audience over time. These metrics can help you determine audience retention levels and find out if your audience is growing or shrinking. After opening the Engagement Explore: 1. In the sidebar, select **Response - Tag Changes**. 1. Under **Measures** select any of the following: * Opt In User Count * Opt In User Rate * Opt Out User Count * Opt Out User Rate ## SMS Mobile Originated Explore The SMS Mobile Originated Explore provides information about the SMS messages that your audience sends you. First, open the Explore: 1. Go to **Reports**, then **Performance Analytics**. 1. Select the folder icon (folder-simple), then **Shared**. 1. Under **Looks**, select **Explore Glossary** (**Explore Glossary EUCS** for EU customers). 1. Select **SMS Mobile Originated**, then **Navigate to Explore**. Next, add Dimensions to your query: 1. In the sidebar, go to **Mobile Originated Messages** 1. Under **Dimensions**, select any of the following: | Dimension | Description | | --- | --- | | **Inbound Message** | The inbound message text sent from your audience. | | **Keyword Matched** | The keyword matched in incoming messages. In many cases, the keyword may be the same as the inbound message. If a keyword was not matched, this field is empty. | | **Outbound Message** | The message sent in response to a mobile originated message. | | **Sender** | The originated long code, short code, or alphanumeric sender of an outbound message (sent in response to an inbound message). | | **RCS Message (Yes / No)** | The message was or was not RCS. | ## Custom Events Explore The [SMS Delivery Report](https://www.airship.com/docs/developer/rest-api/connect/schemas/custom-sms-events/#delivery-report) events are the only [Custom Event](https://www.airship.com/docs/reference/glossary/#custom_event) metrics for SMS. It provides Mobile Terminated Delivery events, which are Custom Events sent from our third-party SMS providers. These events report the status of your message between the provider and your audience up to, and including, delivery. This data can help you determine your real message audience by determining how many of your messages were `delivered` as opposed to `aborted`, etc., and check for failures. The report events also include an `is_rcs` boolean property. Custom Events are often more complex than other data sets in Performance Analytics. Use the Custom Events Explore to access delivery report data. First, open the Explore: 1. Go to **Reports**, then **Performance Analytics**. 1. Select the folder icon (folder-simple), then **Shared**. 1. Under **Looks**, select **Explore Glossary** (**Explore Glossary EUCS** for EU customers). 1. Select **Custom Events**, then **Navigate to Explore**. Next, add filters and Dimensions: 1. In the sidebar, select **Custom Events Properties**. 1. Under **Filter-Only Fields**, select **User Defined Property 1 Filter**, then set the filter value as equal to `error_code` for SMS or `result_code` for MMS. This separates your Mobile Terminated events by the [error codes](https://www.airship.com/docs/developer/api-integrations/sms/sms-error-codes/) from third-party short message service centers. These codes represent the status of your messages. 1. In the sidebar, select **Custom Events**. 1. Under **Dimensions**, select the filter icon (funnel-simple) next to **Custom Event Name**, then set the filter value as equal to the [SMS Delivery Report Event `name`](https://www.airship.com/docs/developer/rest-api/connect/schemas/custom-sms-events/#delivery-report) values you want to see. Possible values are `dispatched`, `aborted`, `rejected`, `delivered`, `failed`, `expired`, `unknown`, and `undeliverable`. 1. Select **Run** to return results. > **Note:** A null `error_code` indicates an MMS message. MMS messages use a `result_code`. To check the statuses of MMS messages, set a **User Defined Property** filter to `result_code` and filter the Custom Event name for `dispatched`, `delivered`, and `failed`. 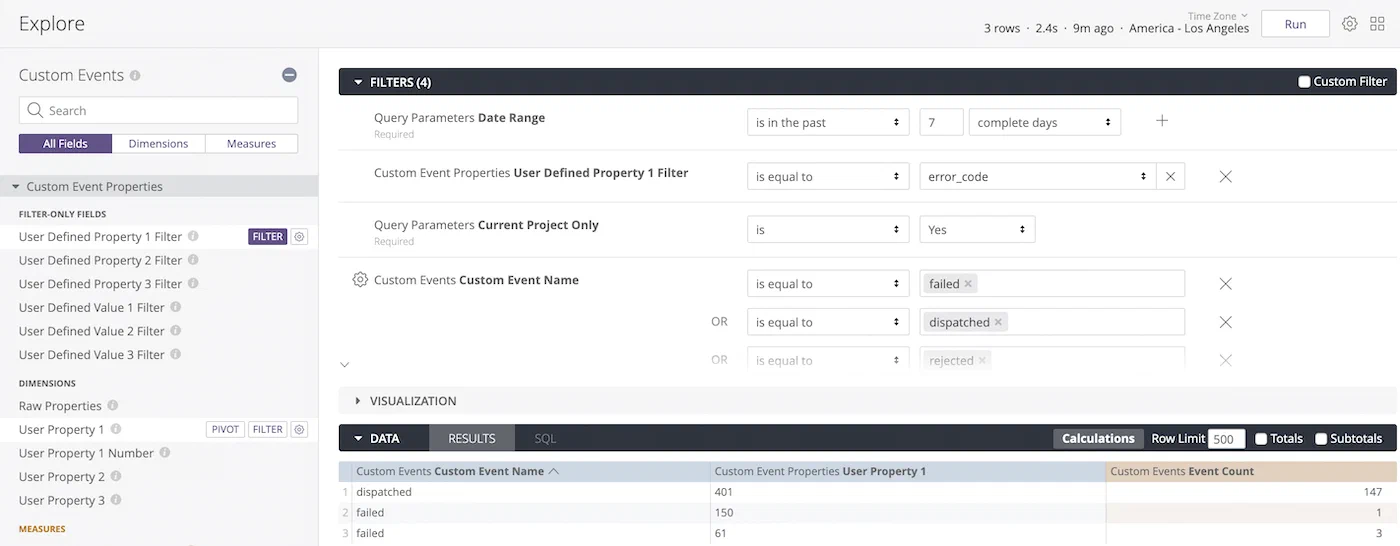 *The Custom Events Explore in Performance Analytics* ### Exploring Learn about the queries behind Looks and the ways you can explore your data. # Exploring Performance Analytics data > Learn how to create custom queries. Looks are built using queries of the data in your project and displayed according to the visualization format set for the Look, such as Table, Timeline, or Single Value. This page explains how to view the queries behind the Looks and the ways you can explore your data. ## The Explore view The base query of a Look is called an *Explore*. In any Look, hover and select the more menu icon (⋮), then select **Explore from here**. This opens the Explore view, where you can see the selections, entries, and filters used to generate the information included in the query. From here, you can start customizing queries. 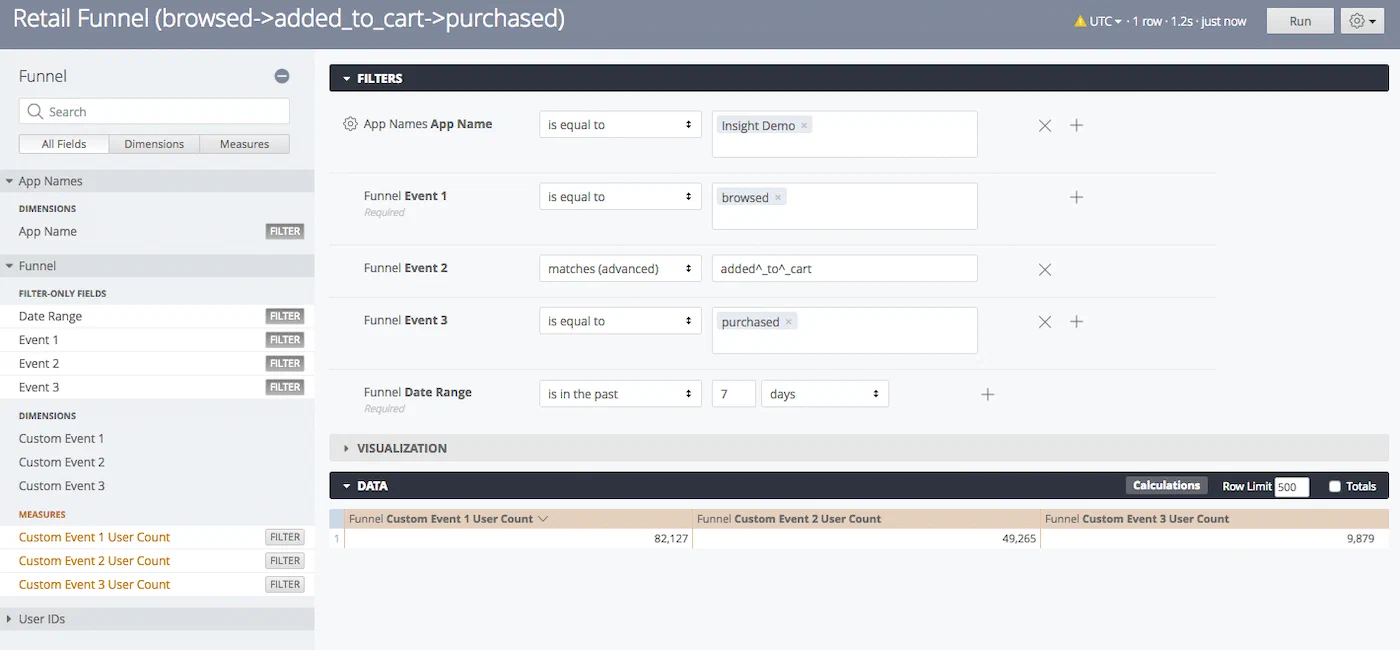 *The Explore view of the Funnel Look in the Revenue Dashboard* Explore view sections: | Section | Description and actions | | --- | --- | | **Sidebar** | At the top is the [Explore name](#explore-definitions), followed by a search field for filters, [Dimensions](https://www.airship.com/docs/reference/glossary/#pa_dimension), and [Measures](https://www.airship.com/docs/reference/glossary/#pa_measure) grouped in fields below it.
Selections made here are immediately reflected in the Filters and Data sections. Separate tabs show All Fields and fields that are in use for the current query. | | **Filters** | Use this section to configure the filters in the query.
You add filters by selecting the filter icon (funnel-simple) for a Measure or Dimension in the sidebar. Select the add icon (+) or the remove icon (×) in a filter row to add or remove filters of the same type. Multiple filters of the same type are processed as a boolean OR.
The default value for the App Name filter is the current Airship project name. Operators and input support vary by field. For example a time dimension supports setting a time range, and text dimensions return matching values as you type.
To manually add filtering expressions, select the box for **Custom Filter** to expose the entry field.
Select **Run** after making changes. Only rows for which conditions are true will be returned in results. | | **Visualization** | The Explore view opens to a default visualization format, one of Table, Column, Bar, Scatterplot, Line, Area, Pie, Map, Single Value, Static Map (Regions), Static Map (Points), Donut Multiples, or Single Record.
To view the data in another format, select an icon in the Visualization section header. Hover over an icon to see its label. You may need to select the more menu icon (⋯) to expose all options. Select **Edit** for options specific to the current format. *The Visualization section header in the Explore view*Some Visualization types may be incompatible with the currently selected Dimensions and Measures. | | **Data** | This section is essentially the Table visualization format. You can set the maximum number of rows to return and whether or not to display totals. *The Data section header in the Explore view* See also [Saving Queries](https://www.airship.com/docs/guides/reports/analytics/tasks-queries/saving-queries/). | {class="table-col-1-20"} > **Tip:** You can bookmark queries in your web browser after opening the Explore view in a new window: > > * From a Look, hover and select the more menu icon (⋮), then hold down **Ctrl** (Windows) or **Command ⌘** (Mac) on your keyboard and select **Explore from here**. > * From the [Explore glossary](#predefined-explores), select the more menu icon (⋯) next to its name and select **Navigate to Explore**. > > Use your browser’s bookmark feature to save the view. ## Example data exploration Let's find your app's in-app impression rate. To do this we need to add two Measures to the Messages Look.
Data availability depends on your Performance Analytics plan.
## Navigation To access to the Explore: 1. Go to **Reports**, then **Performance Analytics**. 1. Select the folder icon (folder-simple), then **Shared**. 1. Under **Looks**, select **Explore Glossary** (**Explore Glossary EUCS** for EU customers). 1. Select **Audience with Attributes**, then **Navigate to Explore**.For a list of all Explores in the glossary, see Predefined Explores in Exploring Performance Analytics data.
## Field categoriesThe sidebar lists categories for various filters, [Dimensions](https://www.airship.com/docs/reference/glossary/#pa_dimension), and [Measures](https://www.airship.com/docs/reference/glossary/#pa_measure) you can use to explore your data. To see their definitions, hover over an item, then select the info icon (ⓘ).
Field categories in the Audience with Attributes Explore: | Category | Description | | --- | --- | | **Attributes** | Set Attribute parameters for the query. | | **Device Properties** | Get device property values associated with the channels at the time the report is run. | | **Query Parameters** | Target all or specific projects, and specify dates and response windows, where relevant. | | **Report Over Time** | Add filters and Dimensions to report historical data. | | **Tags** | Get Tag values associated with the channels at the time the report is run. | | **User Detail** | Get information about the channel that performed the filtered event. | {class="table-col-1-20"} ### Default filtersUse filters to reduce the number of records scanned and results returned. Each Explore includes filters that cannot be removed from the query.
The filter name, [field category](#field-categories), and usage information for the default filters in the Audience with Attributes Explore: | Filter name | Field category | Use the filter to... | |-------------|----------------|----------------------| | **Current Project Only** | Query Parameters | Determine which projects are included in the query. Default: **Yes**. To include other projects, 1) select **No**, 2) in the sidebar, select **Query Parameters**, 3) under **Dimensions**, select the filter icon (funnel-simple) next to **Project name**, and 4) in the Filters section, choose which projects to include. | | **Current Audience Only** | Report Over Time | Determine whether or not to return your audience's current values only. Default: **Yes**. Select **No** to also return historical values. | {class="table-col-1-20 table-col-2-20"} ## Building custom queries The following sections walk you through using the Audience with Attributes Explore to create custom queries that answer: * How many mobile users can I reach with a [Push Notification](https://www.airship.com/docs/reference/glossary/#push_notification)? And how many with Email or SMS? Is my audience growing? * Within a [Tag Group](https://www.airship.com/docs/reference/glossary/#tag_group), which Tag do users subscribe to the most? Among these users, how many opted out of push notifications? ### Determine audience reach and growth Follow these steps to view historical user counts you can use to analyze your audience evolution. You can filter by Tag, Attribute, or Device Property. In our example, we add the Device Property Filter for notification opt-ins. User counts are listed per platform. First, [open the Audience with Attributes explore](#navigation), and then configure your query: 1. Set up the filters: 1. Leave **Current Project Only** set to `is Yes`. 1. Set **Current Audience Only** to `is No`. 1. In the sidebar, select **Report Over Time**, then the filters **Number of Days, Weeks or Months to Report** and **Report over time by Day, Week, or Month**. > **Tip:** Instead of navigating to filters, Dimensions, and Measures, you can find them using the search box at the top of the sidebar. 1. Set the **Number of...** and **Report over time...** filters to the period of time you want to query. 1. In the sidebar, select **Device Properties**, then **Notification Opt-in Filter**. 1. Set **Notification Opt-in Filter** to `is not null`. 1. 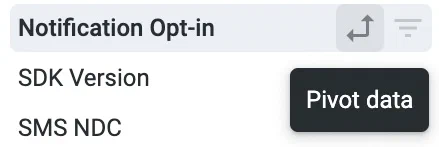 *Selecting the option to pivot data* In the sidebar, specify the values and measurement to display: 1. Select **Report Over Time**, then select the Dimension **Date** or **Month**. Our example uses **Date**. 1. Select **User Detail**, then select the Dimension **Platform**, then select the double-arrow icon next to **Platform**. The pivot option adds detailed metrics for each platform and makes it more readable. It can be helpful when using the Graph visualization. 1. Select **User Detail**, then select the Measure **User Count**.Now you are ready to get your data. Select Run, and you should see results similar to the below image. To save your custom query for later access, follow the steps in Saving Performance Analytics queries.
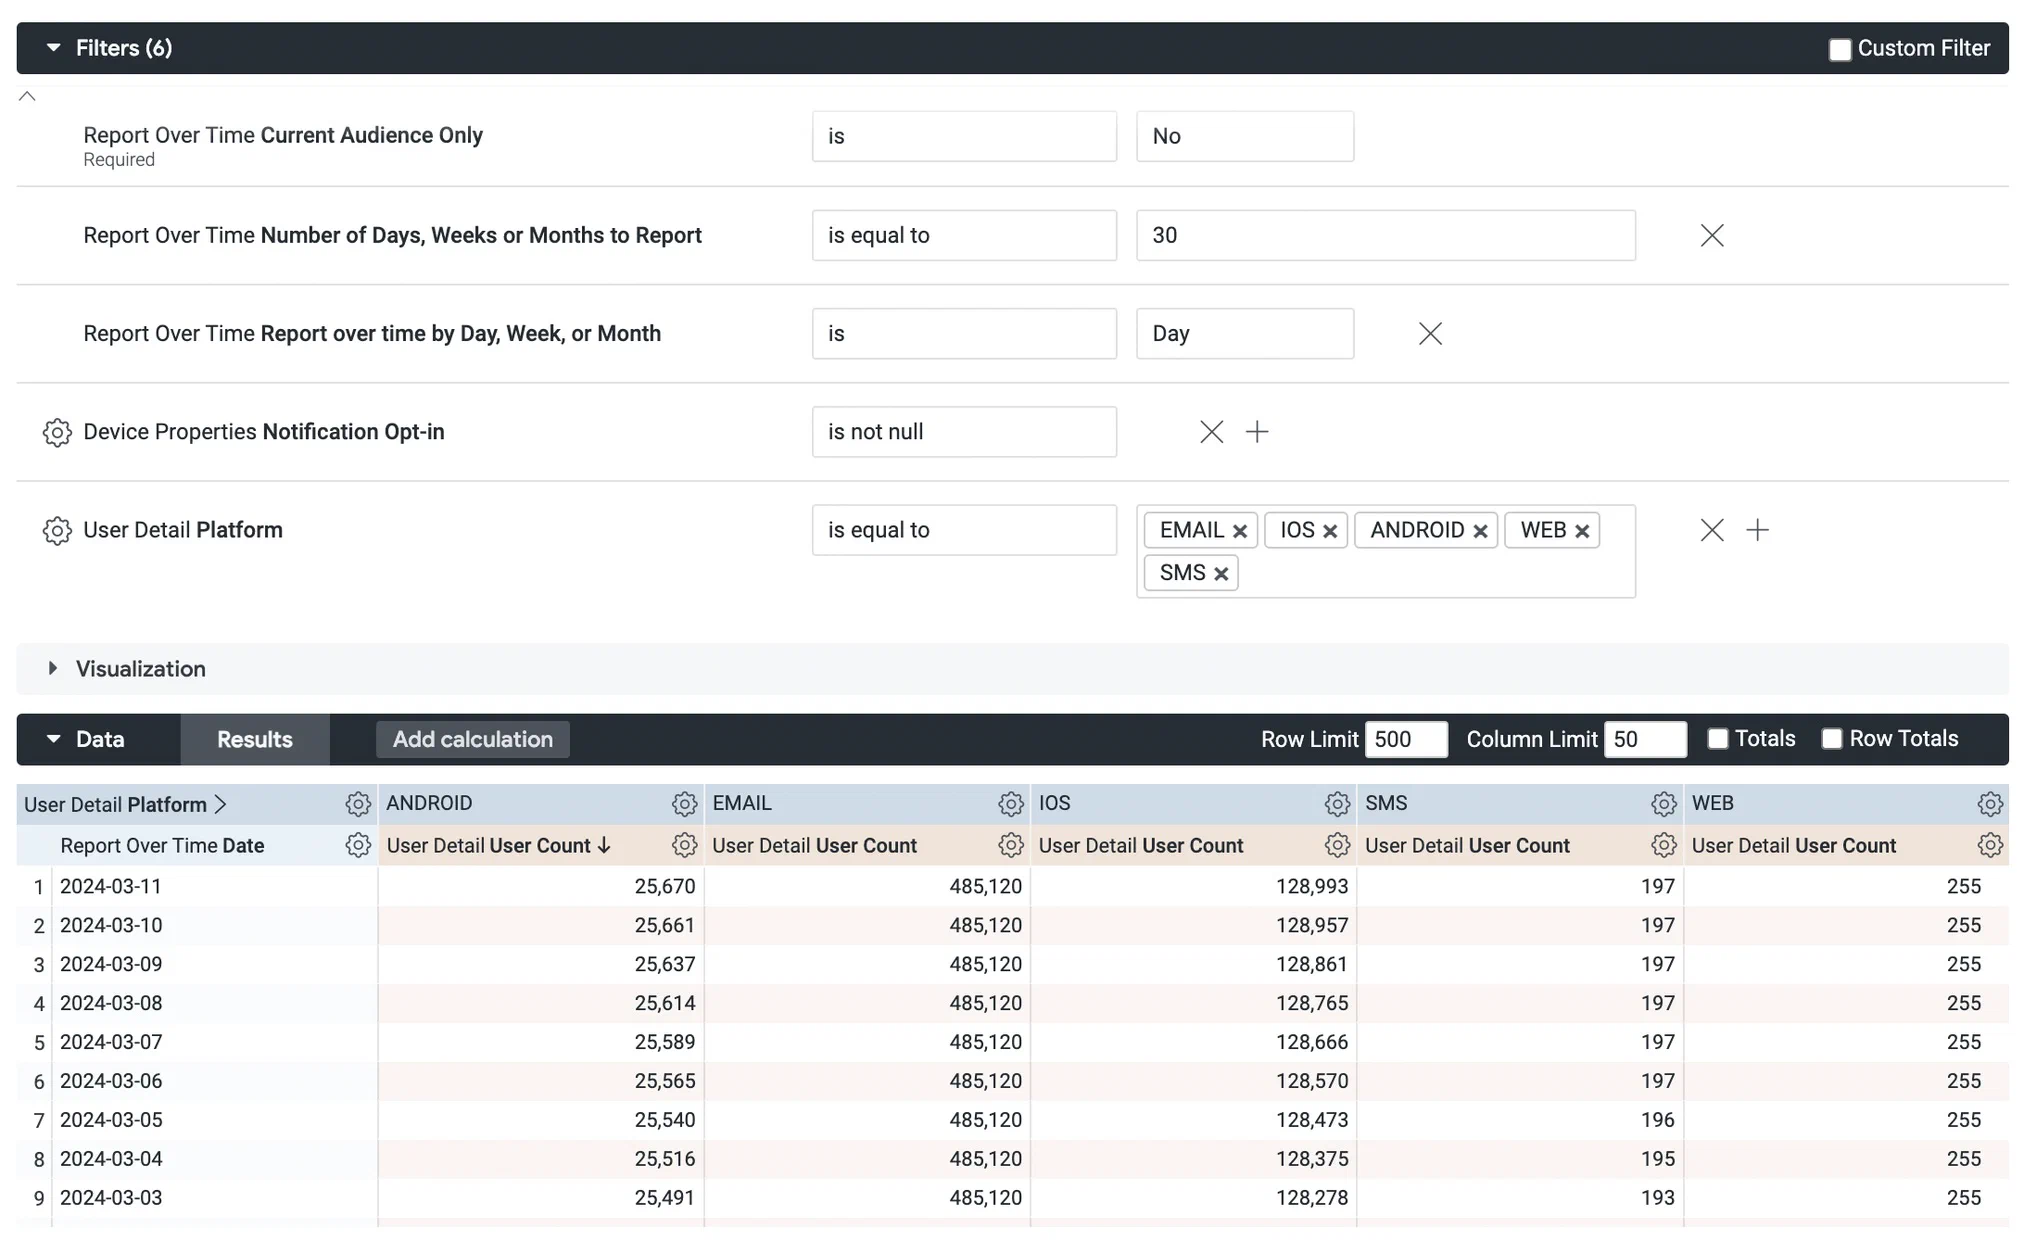 *Creating a custom query from the Audience with Attributes Explore* ### Find Tags and opt-outs Follow these steps to find which Tags in a Tag Group users subscribe to the most and how many opted out of push notifications. First, [open the Audience with Attributes explore](#navigation), and then configure your query: 1. Set up the filters: 1. Leave **Current Project Only** set to `is Yes`. 1. Leave **Current Audience Only** set to `is Yes`. 1. In the sidebar, select **Device Properties**, then **Notification Opt-in Filter**. 1. Set **Notification Opt-in Filter** to `is not null`. 1. In the sidebar, select **Tags**, then **#1 Tag Group Filter**. Then set it to `is equal to` and enter the name of the Tag Group you want to return Tags for. 1. (Optional, to return specific tags in the filtered Tag Group) In the sidebar, select **Tags**, then **#1 Tag Name Filter**. Then set it to `is equal to` and enter the names of Tags in the Tag Group. 1. In the sidebar, specify values and measurements to display: 1. Select **Tags**, then select the Dimensions **#1 Tag Group** and **#1 Tag Name**. 1. Select **User Detail**, then select the Measure **User Count**. 1. 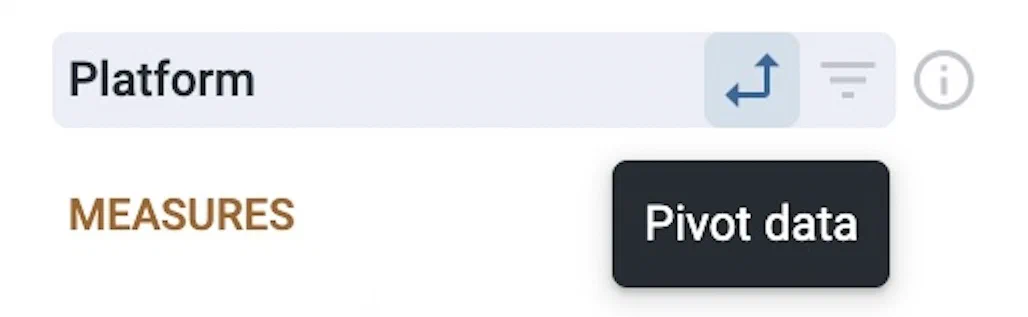 *Selecting the option to pivot data* Select **Device Properties**, then select the Dimension **Notification Opt-in**, then select the double-arrow icon next to **Notification Opt-in**. The pivot option adds detailed metrics for each platform and makes it more readable. 1. In the **Data** header, select the **Row Totals** check box to display the sum of opted in and opted out channels that have each Tag.Now you are ready to get your data. Select Run, and you should see results similar to the below image. To save your custom query for later access, follow the steps in Saving Performance Analytics queries.
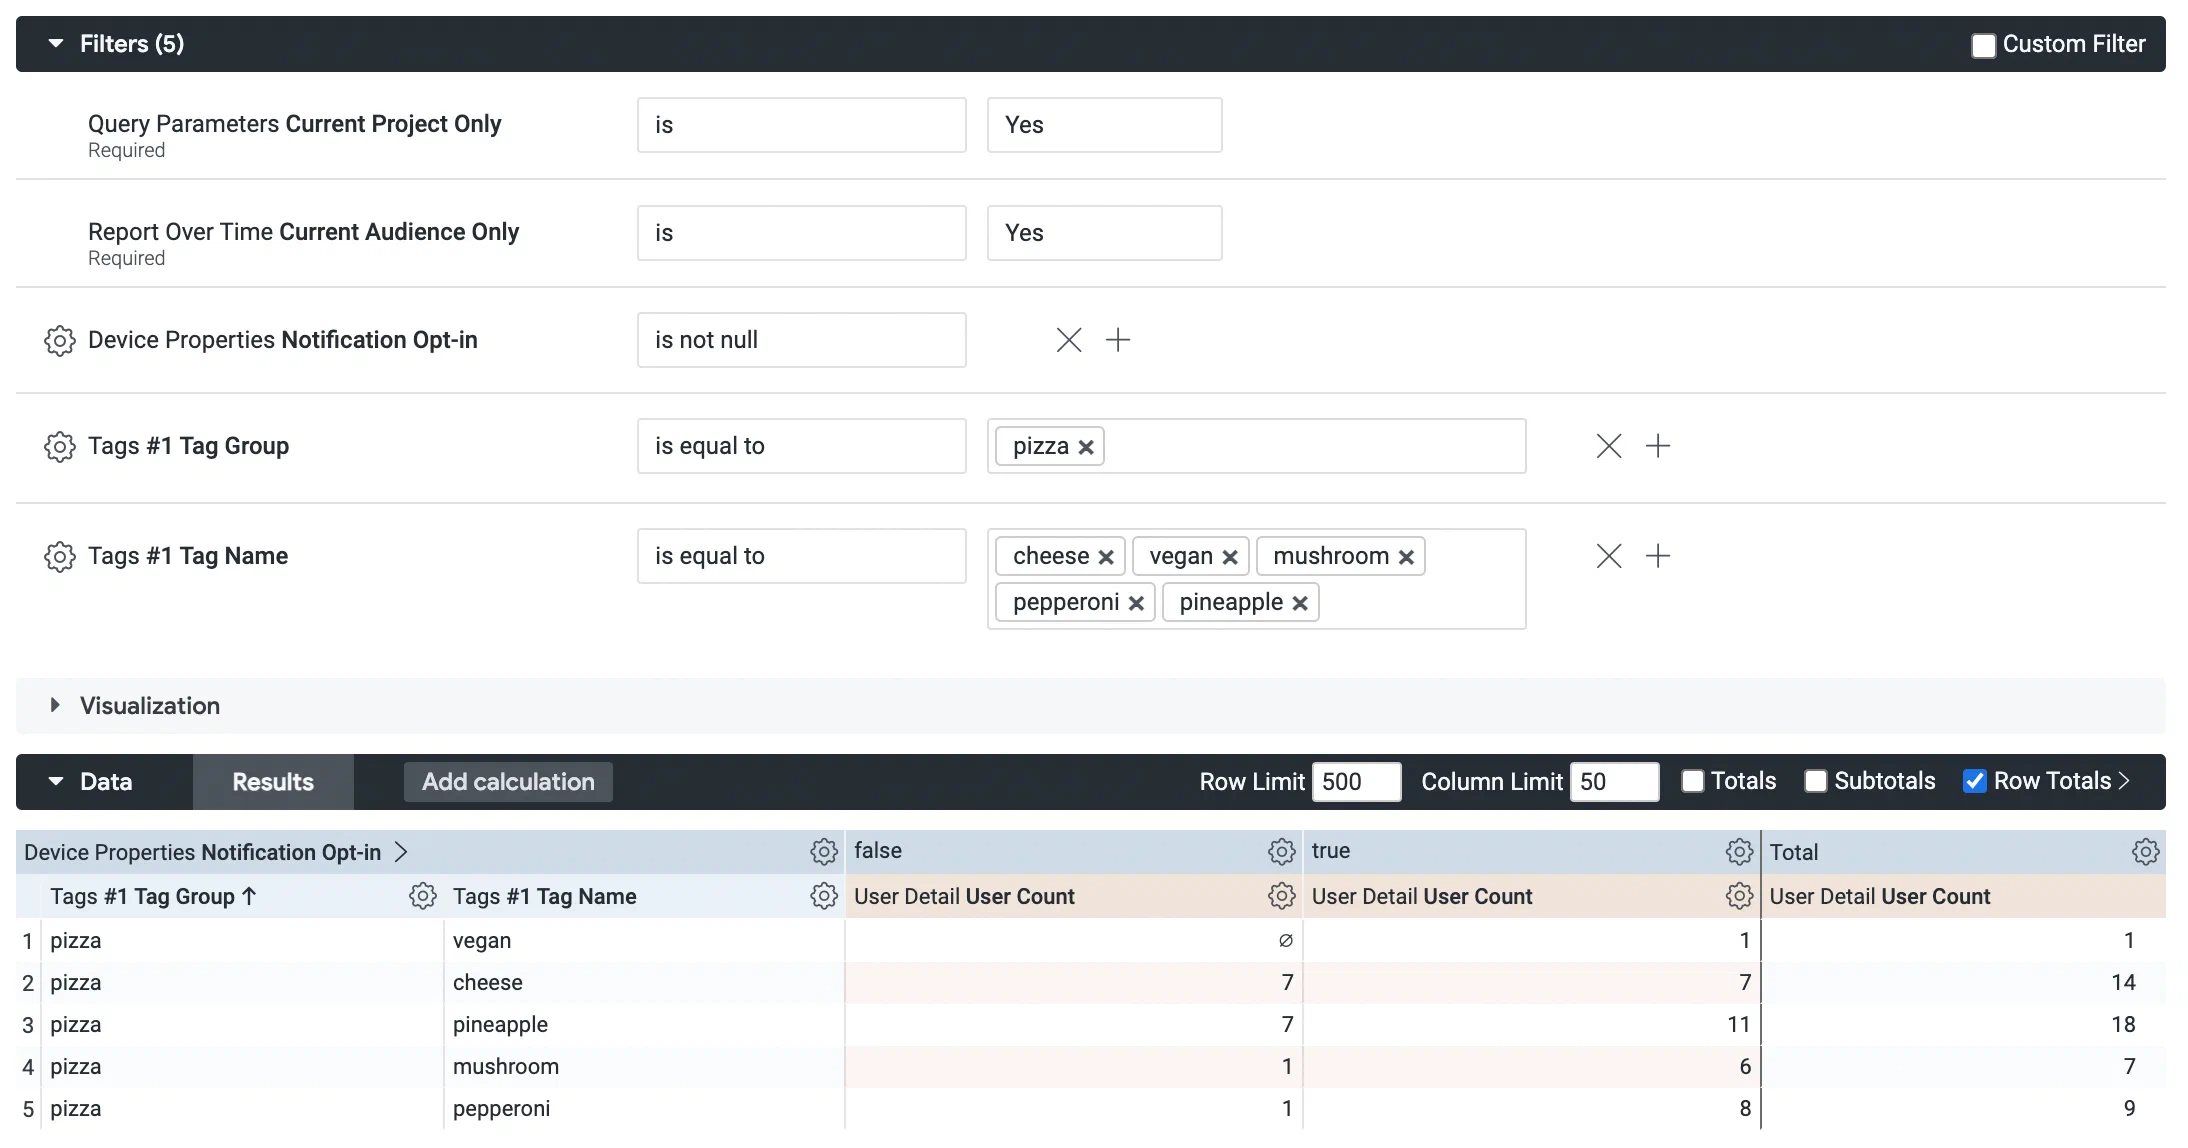 *Creating a custom query from the Audience with Attributes Explore* # Custom queries and reference for the Custom Events Explore > Use the Custom Events Explore to query Custom Event metrics, list users by event, and find peak engagement times. This Explore allows you to get detailed metrics for your [Custom Events](https://www.airship.com/docs/reference/glossary/#custom_event).Data availability depends on your Performance Analytics plan.
## Navigation To access the Explore: 1. Go to **Reports**, then **Performance Analytics**. 1. Select the folder icon (folder-simple), then **Shared**. 1. Under **Looks**, select **Explore Glossary** (**Explore Glossary EUCS** for EU customers). 1. Select **Custom Events**, then **Navigate to Explore**.For a list of all Explores in the glossary, see Predefined Explores in Exploring Performance Analytics data.
## Field categoriesThe sidebar lists categories for various filters, [Dimensions](https://www.airship.com/docs/reference/glossary/#pa_dimension), and [Measures](https://www.airship.com/docs/reference/glossary/#pa_measure) you can use to explore your data. To see their definitions, hover over an item, then select the info icon (ⓘ).
Field categories in the Custom Events Explore: | Category | Description | | --- | --- | | **Attributes Current** | Get Attribute values associated with the channels at the time the report is run. | | **Attributes Relative** | Get Attribute values associated with the channels at the time the filtered Custom Event occurred. | | **Custom Event Properties** | Set Custom Event property parameters for the query. | | **Custom Events** | Set Custom Event parameters for the query. | | **Device Properties Current** | Get device property values associated with the channels at the time the report is run. | | **Device Properties Relative** | Get device property values associated with the channels at the time the filtered Custom Event occurred. | | **In-App Automation** | Get configuration details about [In-App Automations](https://www.airship.com/docs/reference/glossary/#iaa), such as priority, dates, and display type (layout/format). | | **Message Content** | Get the Message text and additional details, such as notification ID and title, about the message to which the Custom Event is attributed. | | **Query Parameters** | Target all or specific projects, and specify dates and response windows, where relevant. | | **Tags Current** | Get Tag values associated with the channels at the time the report is run. | | **Tags Relative** | Get Tag values associated with the channels at the time the filtered Custom Event occurred. | | **User Detail** | Get information about the channel that performed the filtered event. | | **User Detail - Derived** | Get historical information about the channel that performed the filtered event. | {class="table-col-1-20"} ### Default filtersUse filters to reduce the number of records scanned and results returned. Each Explore includes filters that cannot be removed from the query.
The filter name, [field category](#field-categories), and usage information for the default filters in the Custom Events Explore: | Filter name | Field category | Use the filter to... | |-------------|----------------|----------------------| | **Current Project Only** | Query Parameters | Determine which projects are included in the query. Default: **Yes**. To include other projects, 1) select **No**, 2) in the sidebar, select **Query Parameters**, 3) under **Dimensions**, select the filter icon (funnel-simple) next to **Project name**, and 4) in the Filters section, choose which projects to include. | | **Date Range** | Query Parameters | Target events that occurred on a specific date or within a specific date range. | {class="table-col-1-20 table-col-2-20"} ## Building custom queries The following sections walk you through using the Custom Events Explore to create custom queries that answer: * How do I get a list of channels that performed a specific event over the past seven days? * How do I determine what time of day users most frequently perform a specific event? ### Get a list of channels Follow these steps to get a list of channels that performed a specific Custom Event over the past seven days. First, [open the Custom Events explore](#navigation), and then configure your query: 1. Set up the filters: 1. Leave **Current Project Only** set to `is Yes`. 1. Leave **Date Range** set to `is in the last 7 complete days`. 1. Select **+ Add Filter** and select **Custom Events**, then **Custom Event Name**, and enter your event name, for example, `item_purchase`. Only events that occurred within the past 90 days are available. 1. In the sidebar, specify the values and measures to display: 1. Select **User Detail**, then select the Dimension **Channel ID**. 1. Select **Custom Events**, then select the Measure **Event Count**.Now you are ready to get your data. Select Run, and you should see results similar to the below image. To save your custom query for later access, follow the steps in Saving Performance Analytics queries.
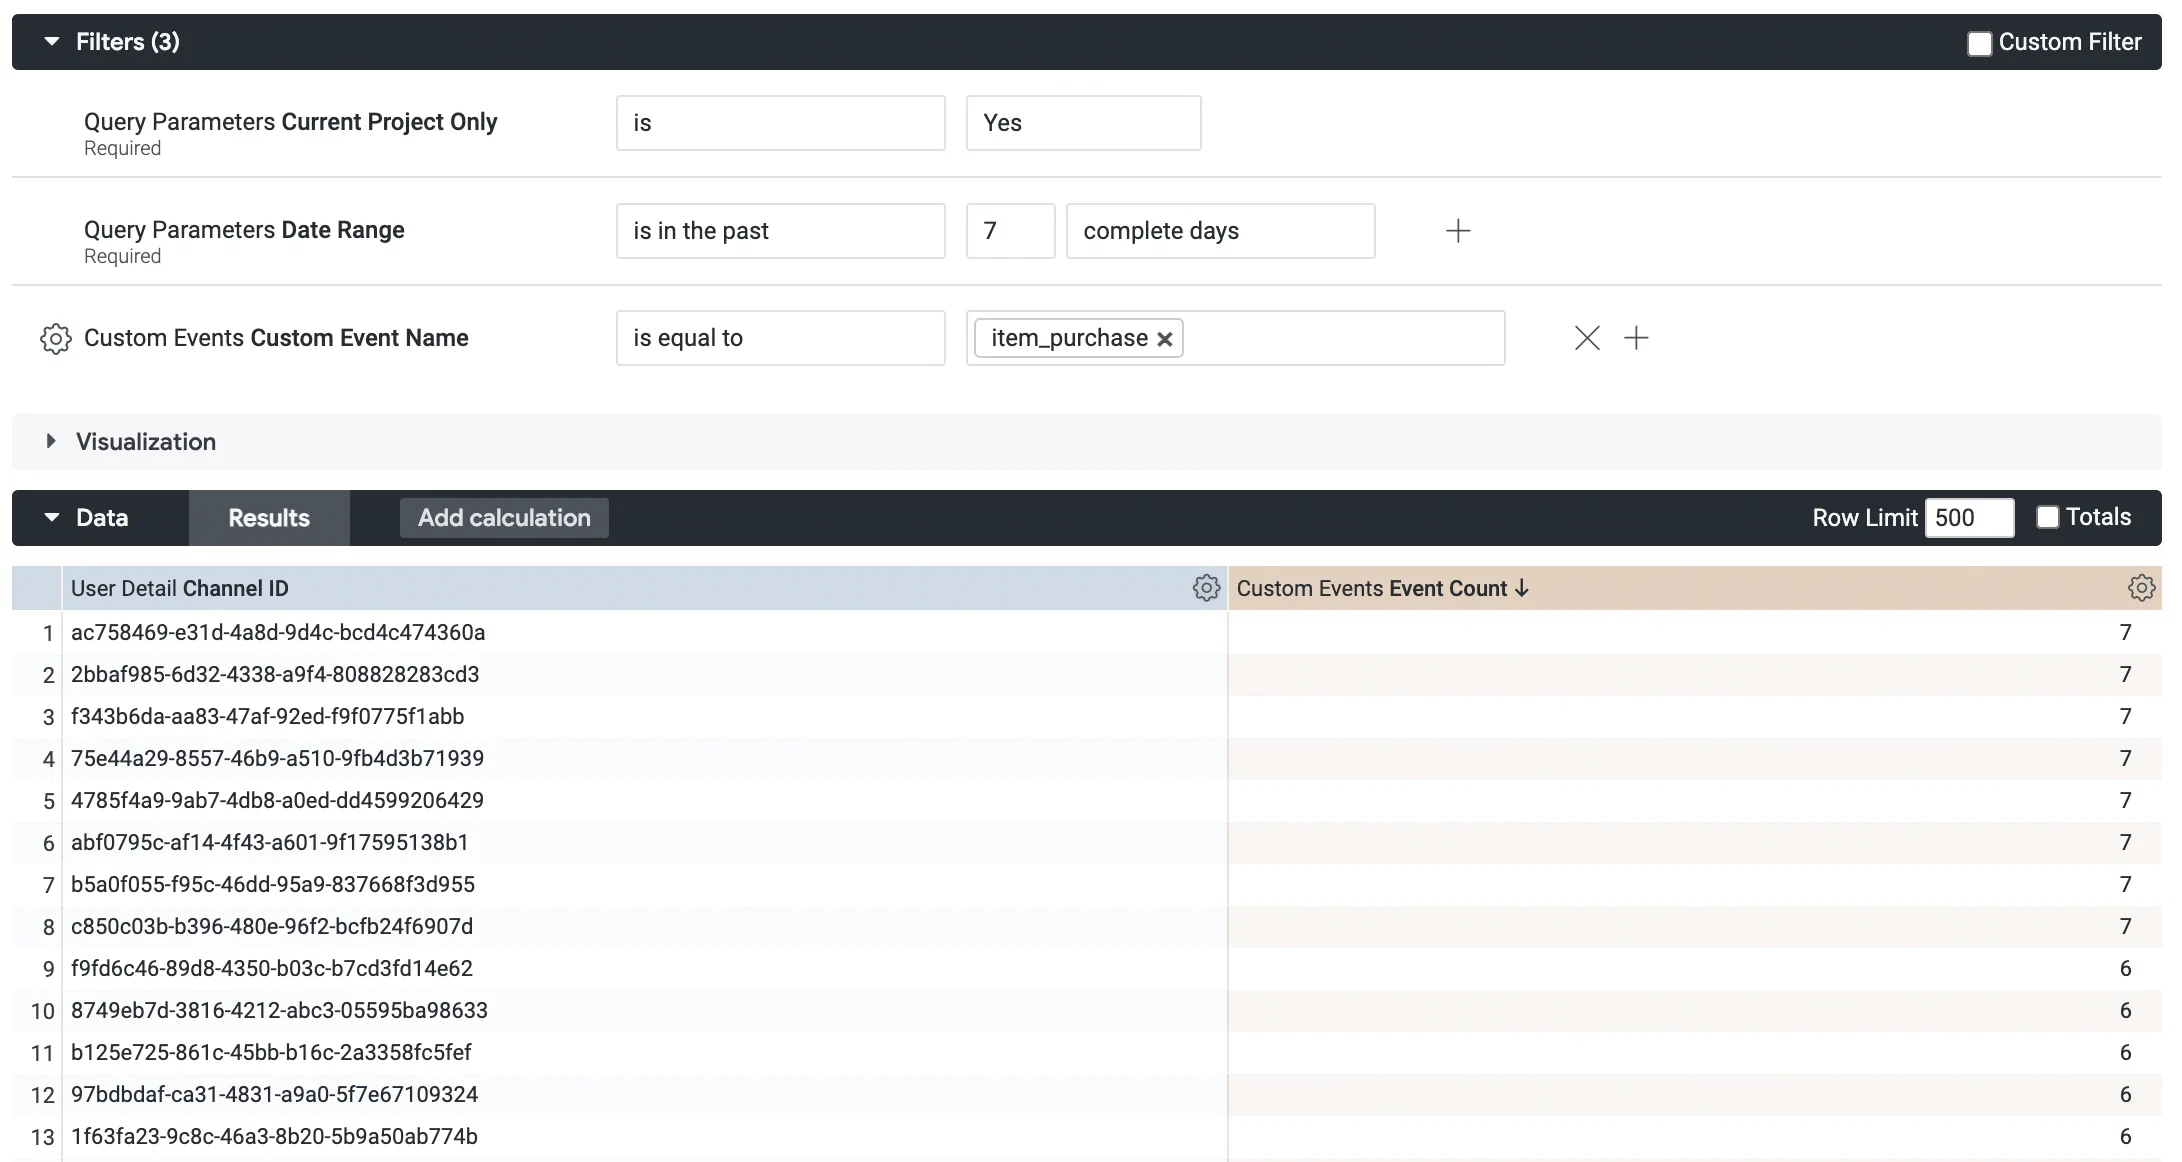 *Creating a custom query from the Custom Events Explore* ### Find peak engagement times Follow these steps to identify the times of day when a Custom Event is most frequently performed. This information can help determine the most relevant time of day to send your campaigns. First, [open the Custom Events explore](#navigation), and then configure your query: 1. Set up the filters: 1. Leave **Current Project Only** set to `is Yes`. 1. Set **Date Range** to `is in the last 90 complete days`. 1. Select **+ Add Filter** and select **Custom Events**, then **Custom Event Name**, and enter your event name, for example, `order_completed`. Only events that occurred within the past 90 days are available. 1. In the sidebar, specify the values and measures to display: 1. Select **Custom Events**, then select **Custom Event Date** and choose **Hour of Day**. 1. Select **Custom Events**, then select the Measure **Event Count**. Now you are ready to get your data. Select **Run**, and you should see results similar to the image below. 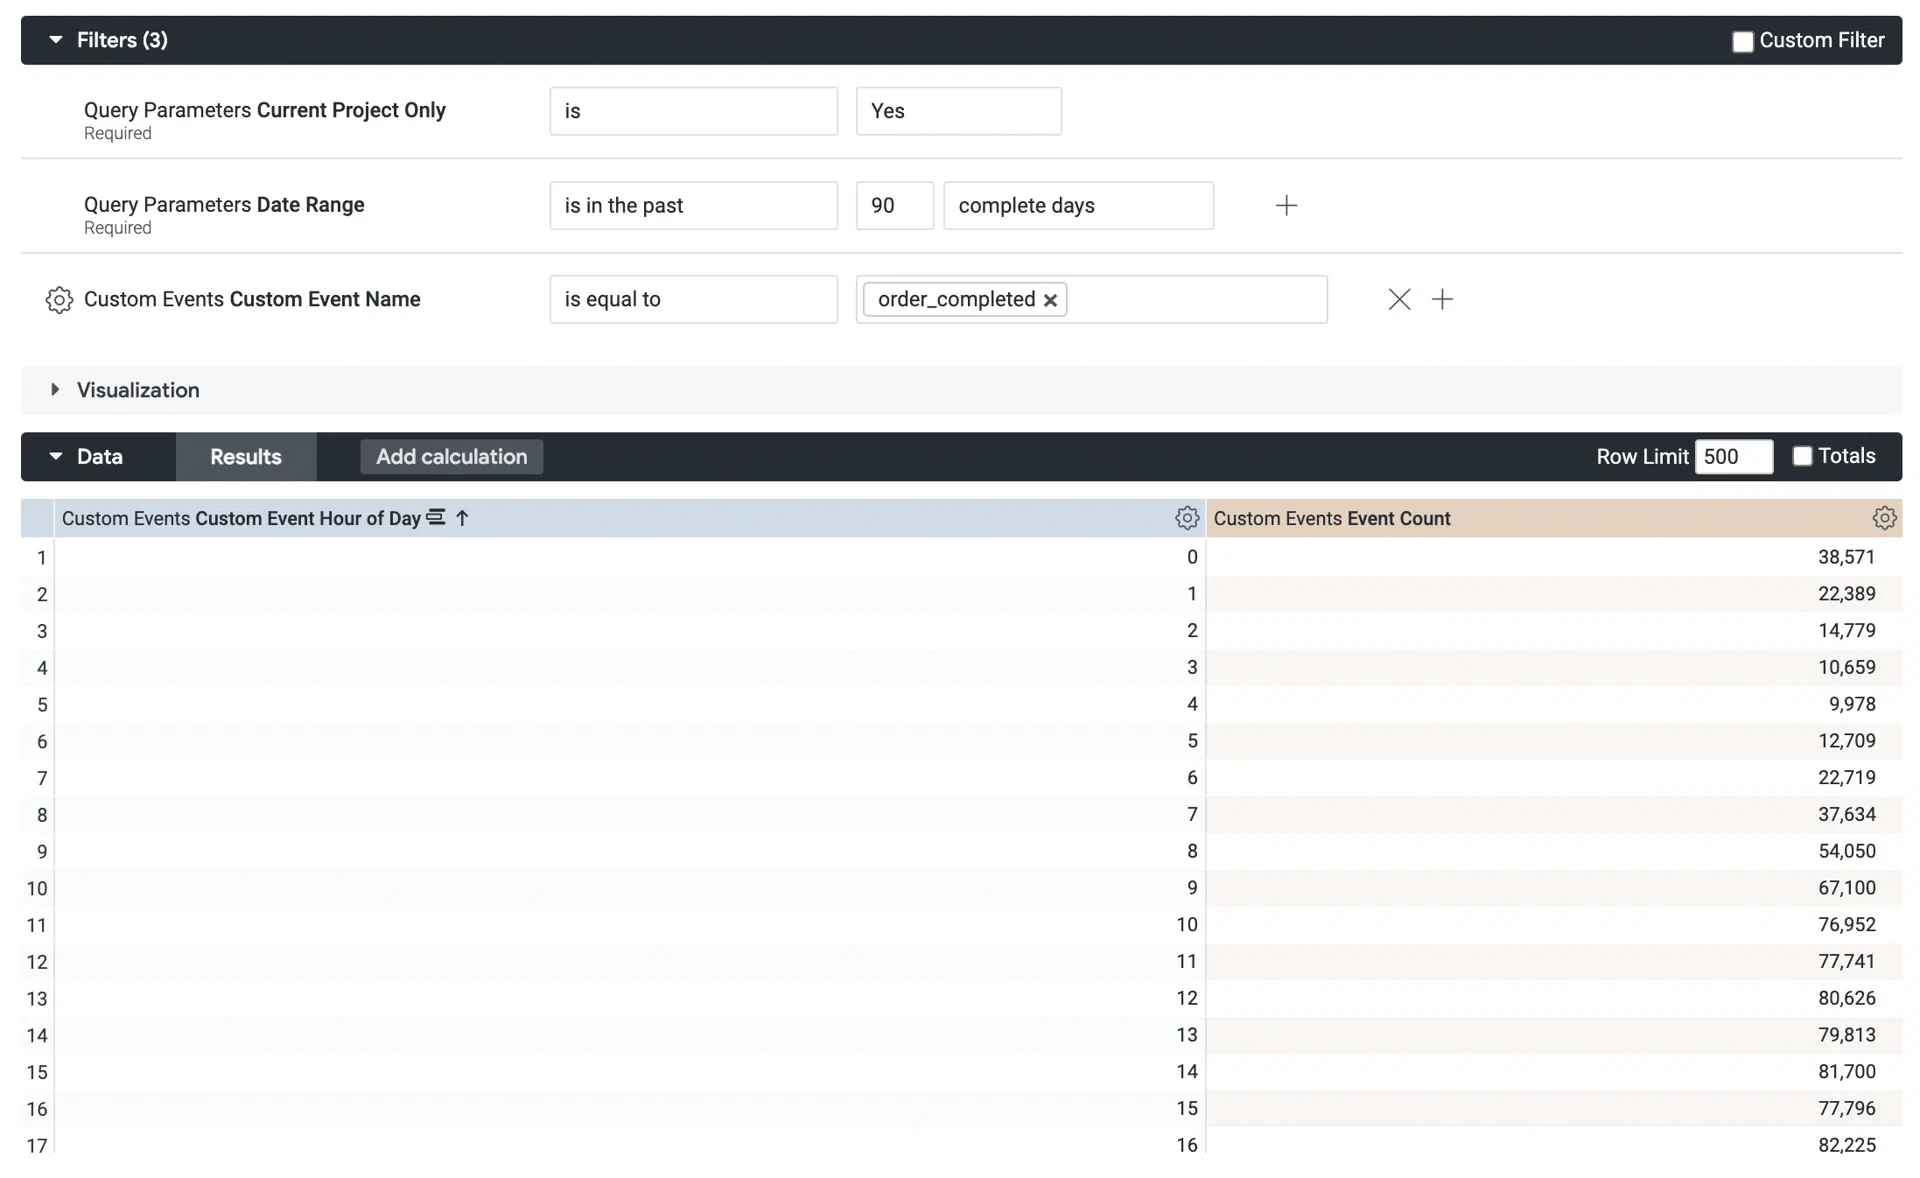 *Creating a custom query from the Custom Events Explore* Next, select the down arrow icon (▼) next to **Visualization** and select the column icon ( ). Use this format to identify the times of day when users are most engaged. You can also add a reference line to make your report clearer. In the Visualization bar, select **Edit**, then **Y**, then **Add Reference Line**. 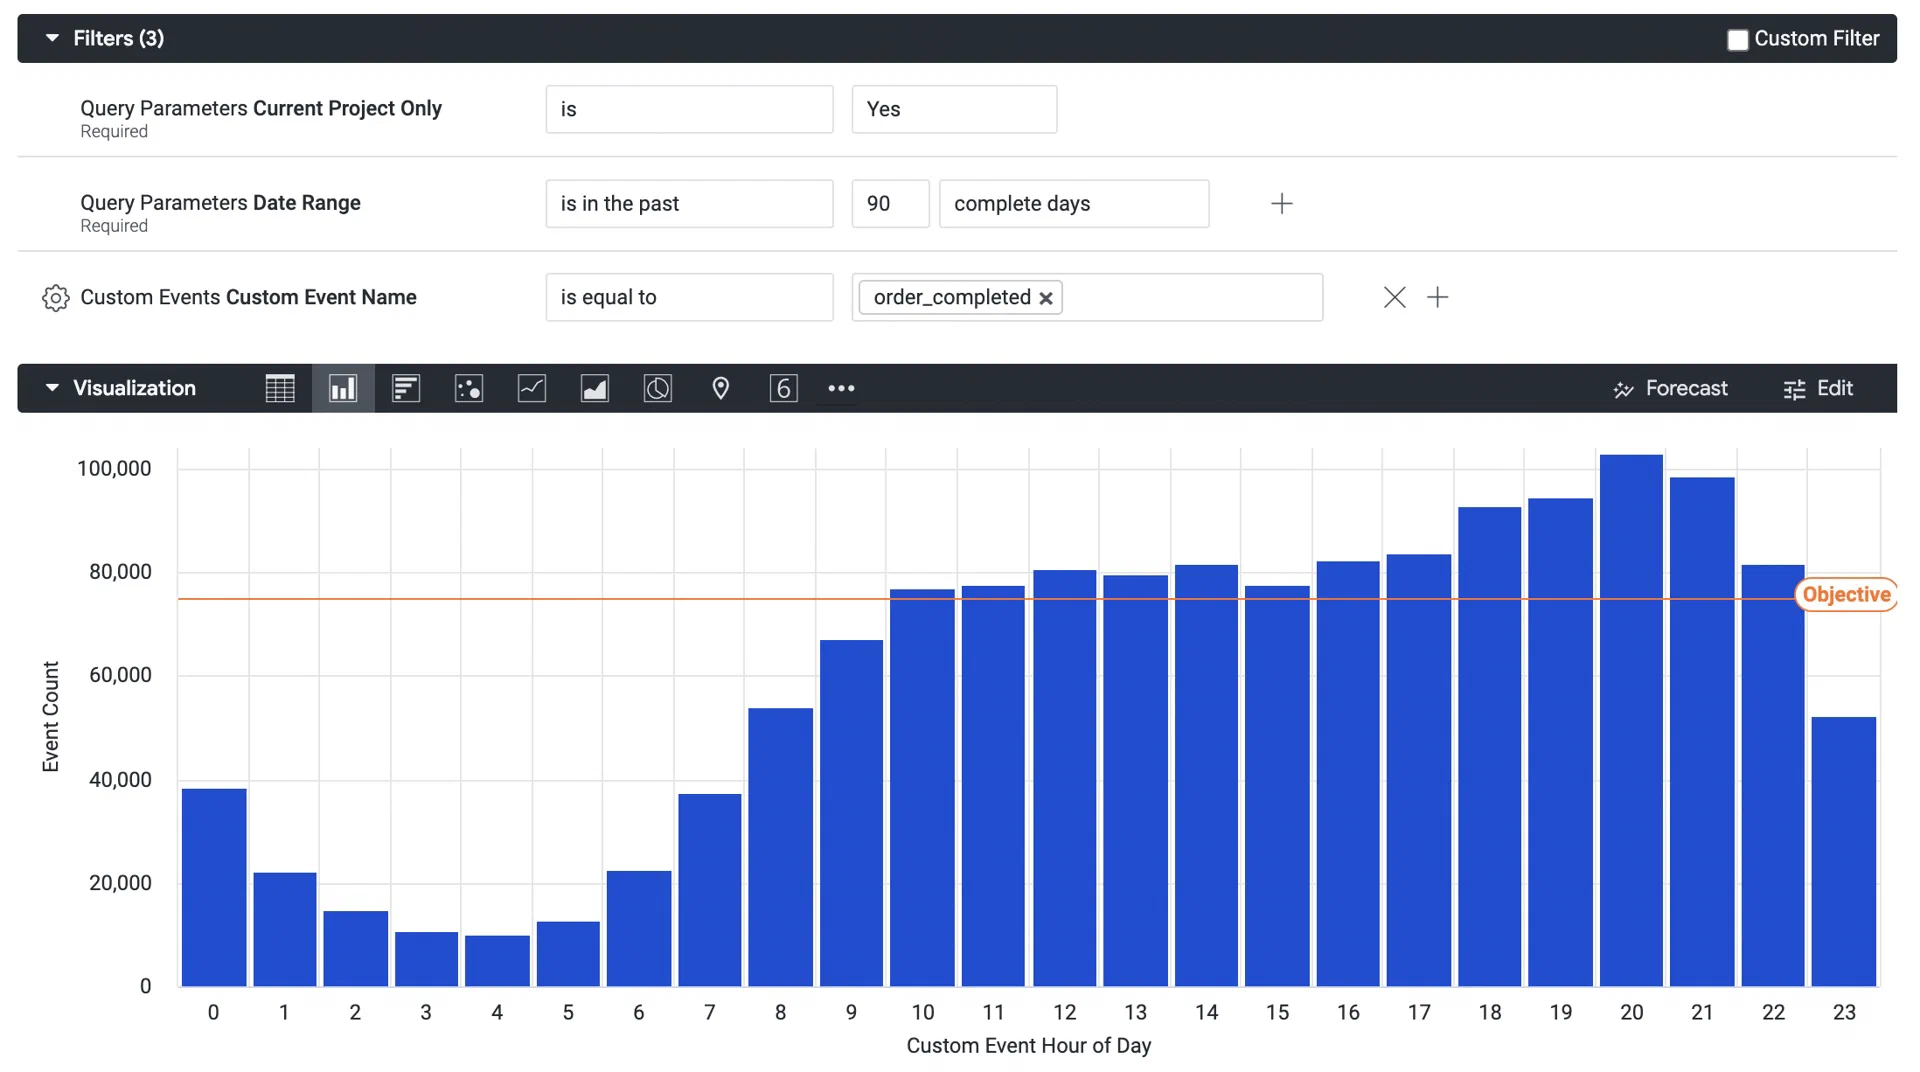 *The column visualization of a custom query from the Custom Events Explore* To save your custom query for later access, follow the steps in [Saving Performance Analytics queries](https://www.airship.com/docs/guides/reports/analytics/tasks-queries/saving-queries/). # Custom queries and reference for the Device Events Explore > Use the Device Events Explore to get data related to device activity. You can get detailed metrics for these default events: App Session, Install, Uninstall, Web Session, SMS First Opt-In, and Email First Opt-In.Data availability depends on your Performance Analytics plan.
## Navigation To access the Explore: 1. Go to **Reports**, then **Performance Analytics**. 1. Select the folder icon (folder-simple), then **Shared**. 1. Under **Looks**, select **Explore Glossary** (**Explore Glossary EUCS** for EU customers). 1. Select **Device Events**, then **Navigate to Explore**.For a list of all Explores in the glossary, see Predefined Explores in Exploring Performance Analytics data.
## Field categoriesThe sidebar lists categories for various filters, [Dimensions](https://www.airship.com/docs/reference/glossary/#pa_dimension), and [Measures](https://www.airship.com/docs/reference/glossary/#pa_measure) you can use to explore your data. To see their definitions, hover over an item, then select the info icon (ⓘ).
Field categories in the Device Events Explore: | Category | Description | | --- | --- | | **Attributes Current** | Get Attribute values associated with the channels at the time the report is run. | | **Attributes Relative** | Get Attribute values associated with the channels at the time filtered event occurred. | | **Device Events** | Set device event parameters for the query. | | **Device Properties Current** | Get device property values associated with the channels at the time the report is run. | | **Device Properties Relative** | Get device property values associated with the channels at the time filtered event occurred. | | **Query Parameters** | Target all or specific projects, and specify dates and response windows, where relevant. | | **Tags Current** | Get Tag values associated with the channels at the time the report is run. | | **Tags Relative** | Get Tag values associated with the channels at the time filtered event occurred. | | **User Detail** | Get information about the channel that performed the filtered event. | | **User Detail - Derived** | Get historical information about the channel that performed the filtered event. | {class="table-col-1-20"} ### Default filtersUse filters to reduce the number of records scanned and results returned. Each Explore includes filters that cannot be removed from the query.
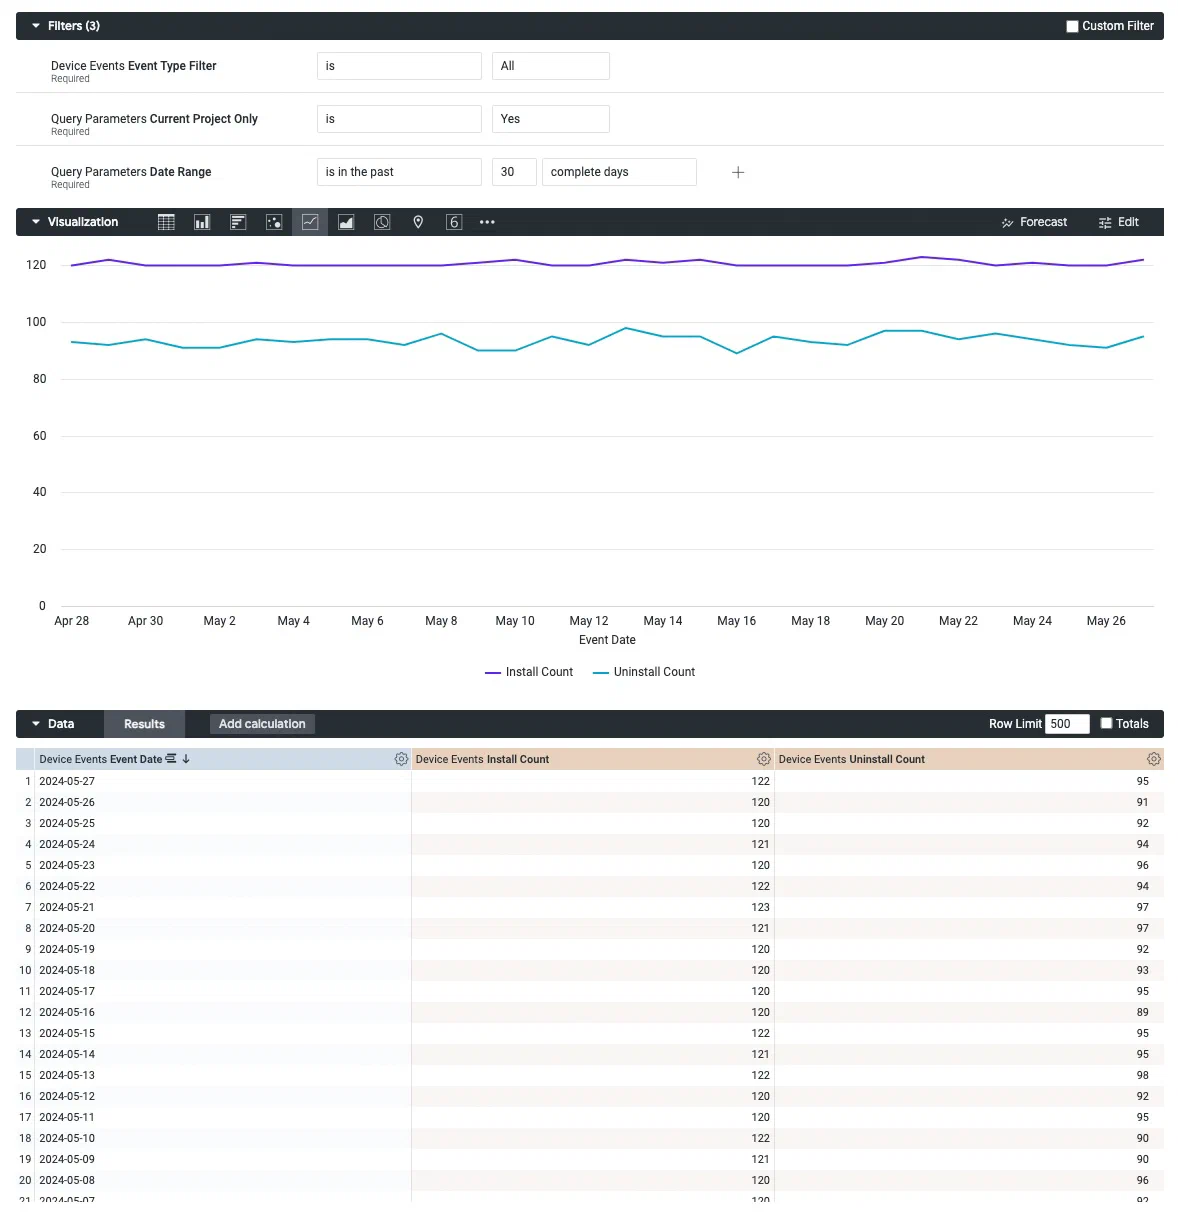
The filter name, [field category](#field-categories), and usage information for the default filters in the Device Events Explore: | Filter name | Field category | Use the filter to... | |-------------|----------------|----------------------| | **Current Project Only** | Query Parameters | Determine which projects are included in the query. Default: **Yes**. To include other projects, 1) select **No**, 2) in the sidebar, select **Query Parameters**, 3) under **Dimensions**, select the filter icon (funnel-simple) next to **Project name**, and 4) in the Filters section, choose which projects to include. | | **Date Range** | Query Parameters | Target events that occurred on a specific date or within a specific date range. | | **Event Type Filter** | Device Events | Return results for a specific event type. Default: **App Session**. Other options: **Install**, **Uninstall**, **Web Session**, **SMS First Opt-In**, **Email First Opt-In**, or **All**. | {class="table-col-1-20 table-col-2-20"} ## Building custom queries The following sections walk you through using the Device Events Explore to create custom queries that answer: * How can I get install and uninstall counts? * How can I determine the hour of the day when my users are the most active? ### Get install and uninstall counts Follow these steps to get the number of install and uninstall events over the past 30 days. First, [open the Device Events explore](#navigation), and then configure your query: 1. Set up the filters: 1. Set **Event Type Filter** to `is All`. 1. Leave **Current Project Only** set to `is Yes`. 1. Set **Date Range** to `is in the last 30 complete days`. 1. In the sidebar, specify values and measures to display: 1. Select **Device Events**, then the Dimension **Event Date**, then **Date**. 1. Also in **Device Events**, select the Measures **Install Count** and **Uninstall Count**. 1. Select the **Line** visualization format to display the report as a line graph.Now you are ready to get your data. Select Run, and you should see results similar to the below image. To save your custom query for later access, follow the steps in Saving Performance Analytics queries.
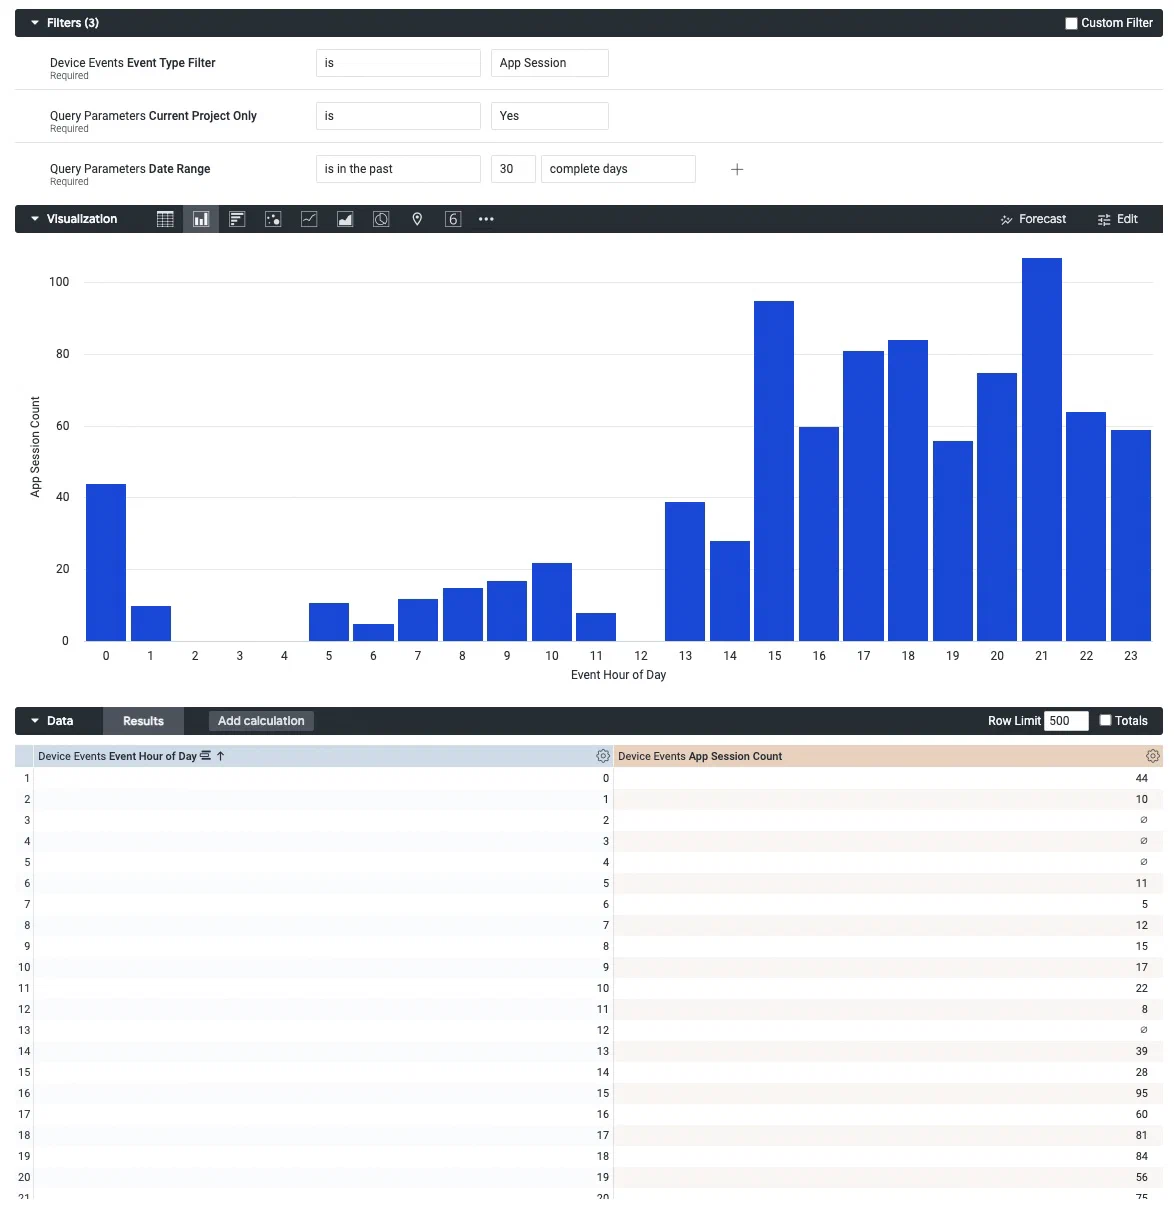
 *Creating a custom query from the Device Events Explore* ### Find the most active hour Follow these steps to determine the hour of the day when your users are the most active. First, [open the Device Events explore](#navigation), and then configure your query: 1. Set up the filters: 1. Leave **Event Type Filter** set to `is App Session`. 1. Leave **Current Project Only** set to `is Yes`. 1. Set **Date Range** to `is in the last 30 complete days`. 1. In the sidebar, specify values and measures to display: 1. Select **Device Events**, then the Dimension **Event Date**, then **Hour of Day**. 1. Also in **Device Events**, select the Measure **App Session Count**. 1. Select the **Column** visualization format to display the report as a column chart / bar graph.Now you are ready to get your data. Select Run, and you should see results similar to the below image. To save your custom query for later access, follow the steps in Saving Performance Analytics queries.
 *Creating a custom query from the Device Events Explore* # Custom queries and reference for the Engagement Explore > Use the Engagement Explore to analyze the performance of your campaigns. You can get metrics and other information about all the events associated with a message, like [Tag](https://www.airship.com/docs/reference/glossary/#tag) and [Attribute](https://www.airship.com/docs/reference/glossary/#attributes) changes and [Custom Events](https://www.airship.com/docs/reference/glossary/#custom_event). Data returned is at the user level.Data availability depends on your Performance Analytics plan.
## Navigation To access to the Explore: 1. Go to **Reports**, then **Performance Analytics**. 1. Select the folder icon (folder-simple), then **Shared**. 1. Under **Looks**, select **Explore Glossary** (**Explore Glossary EUCS** for EU customers). 1. Select **Engagement**, then **Navigate to Explore**.For a list of all Explores in the glossary, see Predefined Explores in Exploring Performance Analytics data.
## Field categoriesThe sidebar lists categories for various filters, [Dimensions](https://www.airship.com/docs/reference/glossary/#pa_dimension), and [Measures](https://www.airship.com/docs/reference/glossary/#pa_measure) you can use to explore your data. To see their definitions, hover over an item, then select the info icon (ⓘ).
Field categories in the Engagement Explore: | Category | Description | | --- | --- | | **A/B Testing** | Get data about [Message A/B tests](https://www.airship.com/docs/guides/experimentation/a-b-tests/messages/). Include the Dimension **A/B Test ID** to query a specific experiment. For [legacy message A/B tests](https://www.airship.com/docs/guides/experimentation/a-b-tests/messages-legacy/), use the Dimensions **Variant Message (Legacy)** and **Variant ID (Legacy)**. | | **Attributes Current** | Get Attribute values associated with the channels at the time the report is run. | | **Attributes Relative** | Get Attribute values associated with the channels at the time push notification or Message Center message was sent or when the in-app message was displayed. | | **Device Properties Current** | Get device property values associated with the channels at the time the report is run. | | **Device Properties Relative** | Get device property values associated with the channels at the time push notification or Message Center message was sent or when the in-app message was displayed. | | **In-App Automation** | Get configuration details about In-App Automations and Scenes, such as priority, dates, and display type (layout/format). | | **Message Content** | Get the message text and additional details, such as notification ID, title, etc. In the Dimension and Measure names, Journey means [Sequence](https://www.airship.com/docs/reference/glossary/#sequence). | | **Message Delivery** | Get data about sends, such as dates, rates, and counts. SMS includes the Dimension **SMS Deliveries — Is RCS (Yes / No)** and the Measure **RCS Read Count**. | | **Message Metrics** | Get performance data, such as response and click rates, including bounce data for email. | | **Query Parameters** | Target all or specific projects, and specify dates and response windows, where relevant. | | **Response - Custom Events** | Get metrics for Custom Events associated with [App direct and indirect opens](https://www.airship.com/docs/guides/audience/events/custom-events/#push-attribution). | | **Response - Custom Event Window** | Get metrics for Custom Events associated with [App direct and indirect opens](https://www.airship.com/docs/guides/audience/events/custom-events/#push-attribution) that occurred within one hour of send time. To set a new time window, go to **Query Parameters** in the sidebar, then select the **Response Window** filter and configure the filter. Fractions of an hour are accepted. | | **Response - Custom Event Window - Time-only** | Get metrics for Custom Events, regardless of attribution, that occurred within one hour of send time. To set a new time window, go to **Query Parameters** in the sidebar, then select the **Response Window** filter and configure the filter. Fractions of an hour are accepted. | | **Response - Custom Interaction Events** | Get metrics for Custom Events associated with an [`interaction_id`](https://www.airship.com/docs/developer/rest-api/ua/schemas/others/#customeventobject). | | **Response - Events Times** | Get metrics for [App direct and indirect opens](https://www.airship.com/docs/guides/audience/events/custom-events/#push-attribution) that occurred within a specific number of minutes after send time. To set a new time window, go to **Query Parameters** in the sidebar, then select the **Response Window** filter and configure the filter. Fractions of an hour are accepted. | | **Response - Tag Changes** | Get Tag change events that occurred within one hour of send time. To set a new time window, go to **Query Parameters** in the sidebar, then select the **Response Window** filter and configure the filter. Fractions of an hour are accepted. | | **Tags Current** | Get Tag values associated with the channels at the time the report is run. | | **Tags Relative** | Get Tag values associated with the channels at the time push notification or Message Center message was sent or when the in-app message was displayed. | | **Timeframe Comparison** | Compare data in Measures for the most recent and prior time frames. Specify time frames in a number of days. | | **User Detail** | Get information about the channel that performed the filtered event. | | **User Detail - Derived** | Get historical information about the channel that performed the filtered event. | {class="table-col-1-20"} ### Default filtersUse filters to reduce the number of records scanned and results returned. Each Explore includes filters that cannot be removed from the query.
The filter name, [field category](#field-categories), and usage information for the default filters in the Engagement Explore: | Filter name | Field category | Use the filter to... | |-------------|----------------|----------------------| | **Message Type Filter** | Message Delivery | Return results for a specific message type. Default: **Push Notification**. Options: **Message Center**, **In-App Impression**1, **Web Notification**, **SMS notification**, **Email Notification**, or **Multiple**. By default, **Multiple** returns all message types, which can result in longer processing time. To limit types, select **Multiple**, then 1) in the sidebar, select **Message Delivery**, 2) under **FILTER-ONLY FIELDS**, select **Message Type Sub Filter**, 3) in the Filters section, choose which message types to include. | | **Current Project Only** | Query Parameters | Determine which projects are included in the query. Default: **Yes**. To include other projects, 1) select **No**, 2) in the sidebar, select **Query Parameters**, 3) under **Dimensions**, select the filter icon (funnel-simple) next to **Project name**, and 4) in the Filters section, choose which projects to include. | | **Date Range** | Query Parameters | Target events that occurred on a specific date or within a specific date range. | {class="table-col-1-20 table-col-2-20"} 1. Includes [In-App Message (standard)](https://www.airship.com/docs/reference/glossary/#in_app_message) and [In-App Automation](https://www.airship.com/docs/reference/glossary/#iaa) only. ## Building custom queries The following sections walk you through using the Engagement Explore to create custom queries that answer: * How can I get the list of users who received a specific In-App Automation? Also, how can I determine whether they interacted with it? * How can I get complete metrics for the push notifications sent within the past 30 days? ### In-App Automation Follow these steps to get the list of users who received a specific [In-App Automation](https://www.airship.com/docs/reference/glossary/#iaa) and determine whether they interacted with it. Users will be identified by [Channel ID](https://www.airship.com/docs/reference/glossary/#channel_id). First, get the ID of the In-App Automation you want to build a query for. From your Airship project: 1. Go to **Messages**, then **Messages Overview**. 1. Find your In-App Automation and select the report icon ( ) to open its message report. 1. In the page URL, copy the section following `push detail/`. It should look similar to: `e68039fc-7c9d-4a49-8a83-d6c8efa0cde6`. Then [open the Engagement explore](#navigation) and configure your query: 1. Set up the filters: 1. Set **Message Type Filter** to `is In-App Impression`. 1. Leave **Current Audience Only** set to `is Yes`. 1. Set **Date Range** to the period of time you want to search in. 1. In the sidebar, select **Message Content**, then **Notification ID Filter**. > **Tip:** Instead of navigating to filters, Dimensions, and Measures, you can find them using the search box at the top of the sidebar. 1. Set **Notification ID Filter** to `is equal to` and enter the notification ID you copied from the message report URL. 1. In the sidebar, specify values to display: 1. Select **Message Content**, then select the Dimensions **Notification ID** and **Notification Name**. 1. Select **Message Delivery**, then select the Dimensions category **Delivery Date**, then **Date**. 1. Select **User Detail**, then select the Dimension **Channel ID**. If you're using [Named Users](https://www.airship.com/docs/reference/glossary/#named_user) in your project, you can also add the Dimension **Named User** to identify these users in your database. 1. In the sidebar, add measurements to display: 1. Select **Message Delivery**, then select the Measures category **All Deliveries/Impressions**, then **Total Delivery/Impression Count**. 1. Select **Message Metrics**, then select the Measures category **In-App Impressions**, then **In-App Button Click Count** and **In-App Dismissed Count**. These distinguish which users interacted with the a button in the message content from the users who selected the Dismiss button to close the message.Now you are ready to get your data. Select Run, and you should see results similar to the below image. To save your custom query for later access, follow the steps in Saving Performance Analytics queries.
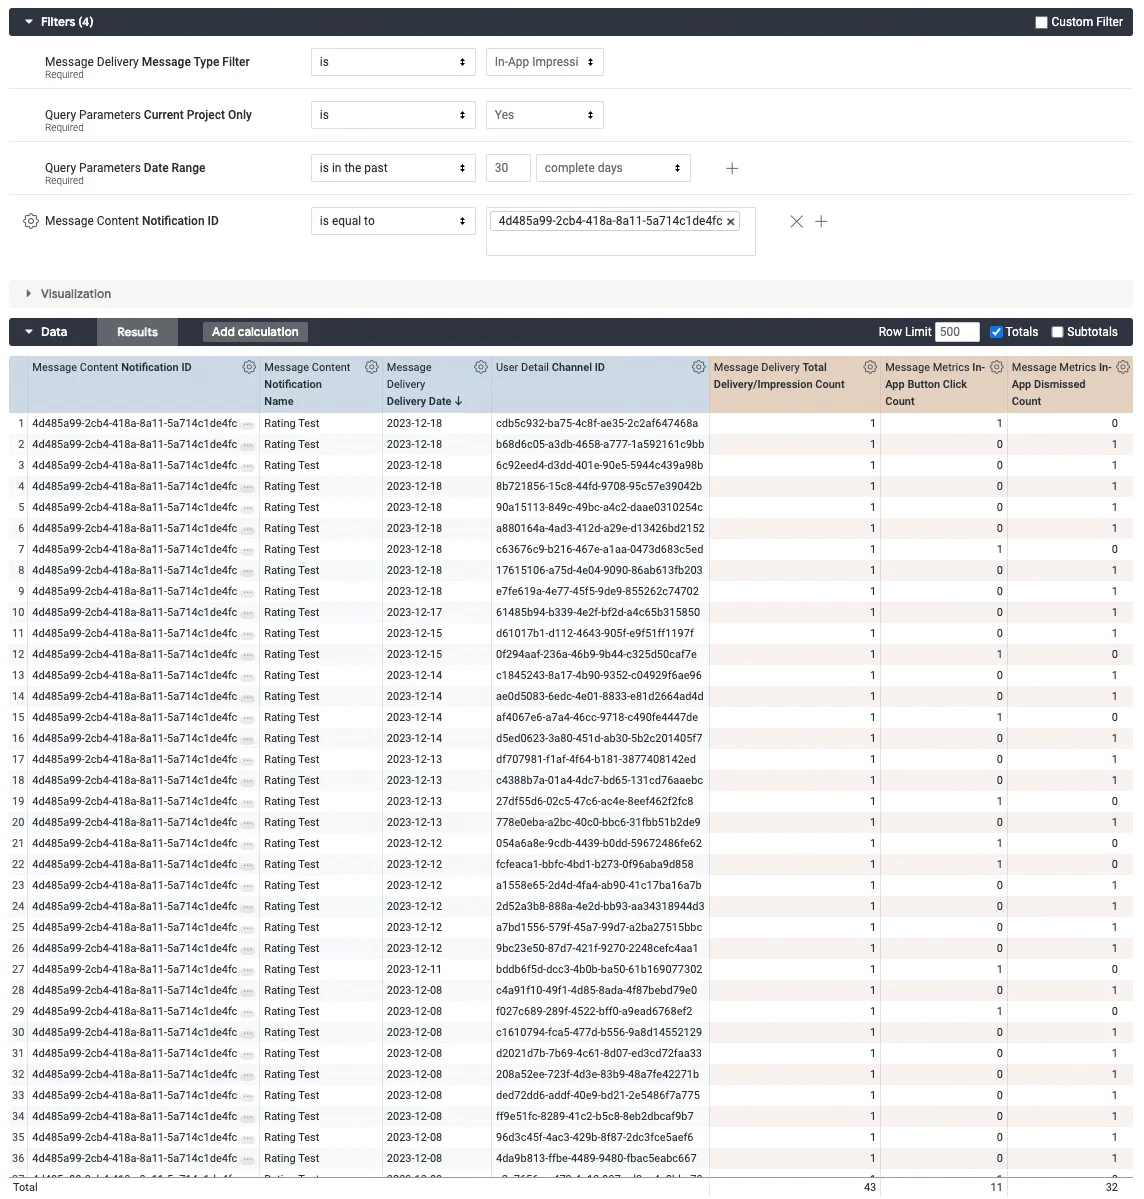 *Creating a custom query from the Engagement Explore* ### Push notifications Follow these steps to get the number of push notifications delivered over the past 30 days. We'll use the default filters and add a filter for platform to get only data for iOS and Android. First, [open the Engagement explore](#navigation), and then configure your query: 1. Set up the filters: 1. Leave **Message Type Filter** and **Current Project Only** set to their defaults `is Push Notification` and `is Yes`. 1. Set **Date Range** to `is in the last 30 complete days`. 1. In the sidebar, select **User Detail**, then **Platform Filter**. > **Tip:** Instead of navigating to filters, Dimensions, and Measures, you can find them using the search box at the top of the sidebar. 1. Leave **Platform Filter** set to `is equal to`, and then select the entry field and select `ANDROID` and `IOS` from the list. 1.  *Selecting the option to pivot data* In the sidebar, specify values to display: 1. Select **Message Delivery**, then select the Dimensions category **Delivery Date**, then **Date**. 1. Select **User Detail**, select the Dimension **Platform**, then select the double-arrow icon next to **Platform**. The pivot option adds detailed metrics for each platform and makes it more readable. It can be helpful when using the Graph visualization. 1. In the sidebar, add measurements to display: 1. Select **Message Delivery**, then select the Measures category **All Deliveries/Impressions**, then **Total Delivery/Impression Count**. 1. Select **Message Metrics**, then select the Measures category **Push Metrics**, then **Attributed Open Count**. Now you are ready to get your data. Select **Run**, and you should see results similar to the image below. 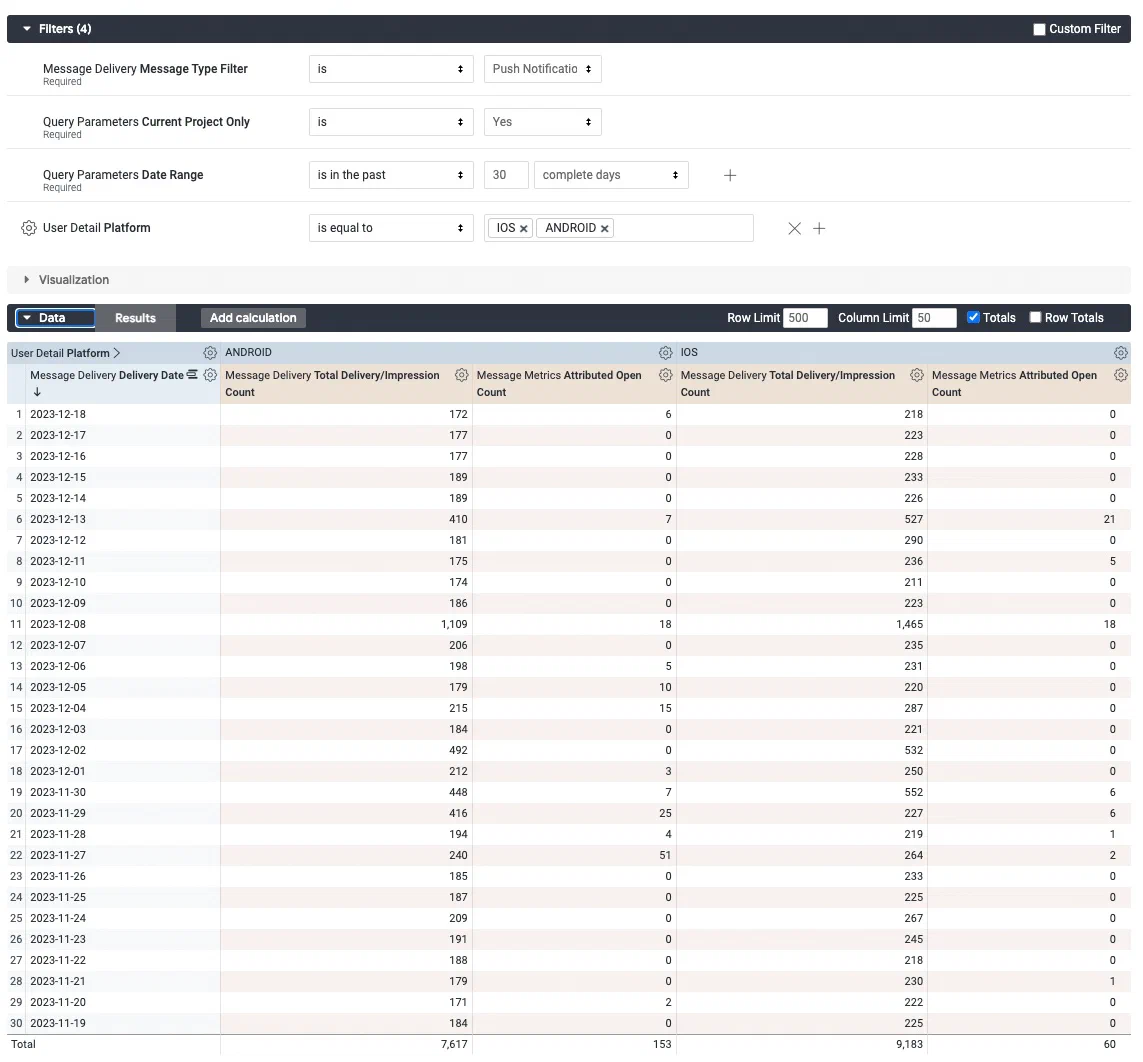 *Creating a custom query from the Engagement Explore* Next, select the down arrow icon (▼) next to **Visualization** and select the column icon ( ). Use this format to look for obvious gaps or other changes to help you identify if something is going wrong with your push delivery: 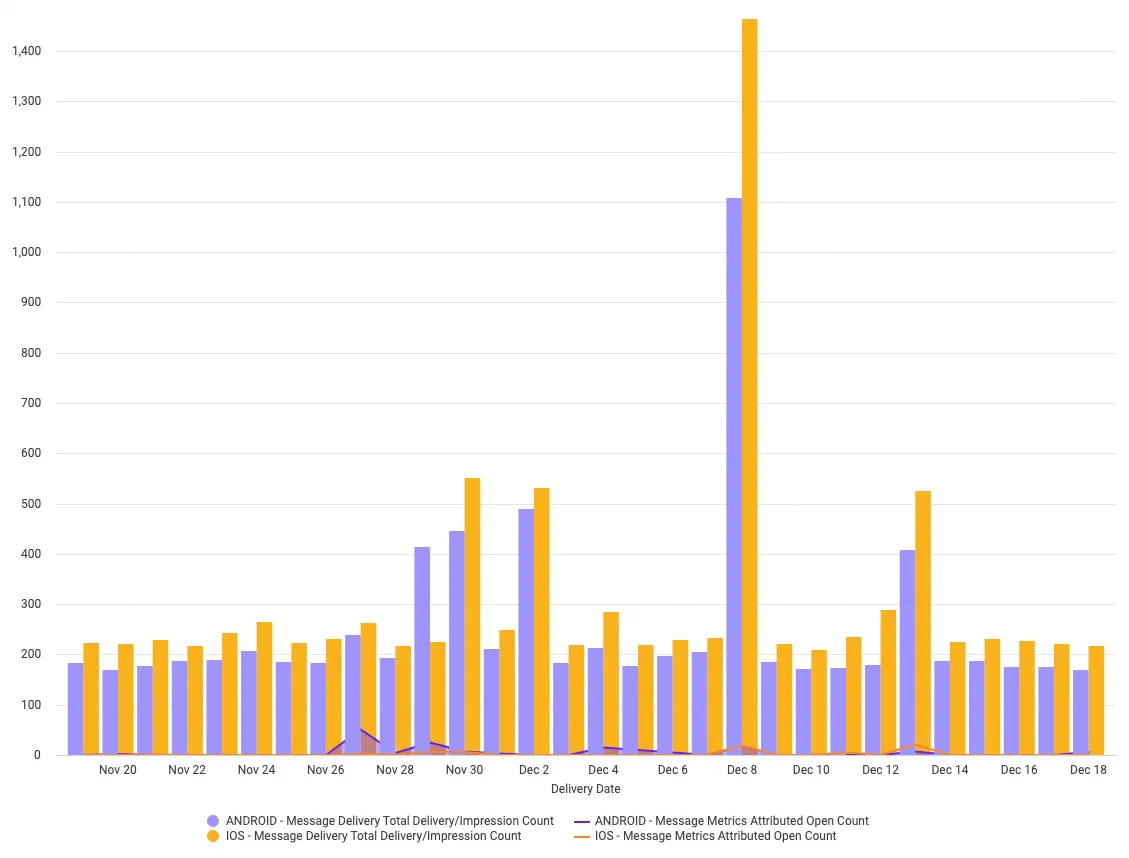 *The column visualization of a custom query from the Engagement Explore* To save your custom query for later access, follow the steps in [Saving Performance Analytics queries](https://www.airship.com/docs/guides/reports/analytics/tasks-queries/saving-queries/). # Custom queries and reference for the Scenes Explore > Use the Scenes Explore to analyze the performance of your Scenes and the relevance of each screen. Access history related to [Scene](https://www.airship.com/docs/reference/glossary/#scene)Data availability depends on your Performance Analytics plan.
## Navigation To access the Explore: 1. Go to **Reports**, then **Performance Analytics**. 1. Select the folder icon (folder-simple), then **Shared**. 1. Under **Looks**, select **Explore Glossary** (**Explore Glossary EUCS** for EU customers). 1. Select **Scenes**, then **Navigate to Explore**.For a list of all Explores in the glossary, see Predefined Explores in Exploring Performance Analytics data.
## Field categoriesThe sidebar lists categories for various filters, [Dimensions](https://www.airship.com/docs/reference/glossary/#pa_dimension), and [Measures](https://www.airship.com/docs/reference/glossary/#pa_measure) you can use to explore your data. To see their definitions, hover over an item, then select the info icon (ⓘ).
Field categories in the Scenes Explore: | Category | Description | | --- | --- | | **Attributes Current** | Get Attribute values associated with the channels at the time the report is run. | | **Attributes Relevant** | Get Attribute values associated with the channels at the time the Scene was displayed. | | **Device Properties Current** | Get device property values associated with the channels at the time the report is run. | | **Device Properties Relative** | Get device property values associated with the channels at the time the Scene was displayed. | | **Query Parameters** | Target all or specific projects, and specify dates and response windows, where relevant. | | **Scenes** | Set Scene parameters for the query. Includes survey-related data if NPS or Questions are included in a Scene. | | **Survey** | Set Survey parameters for the query. Does not include data from Scenes. | | **Tags Current** | Get Tag values associated with the channels at the time the report is run. | | **Tags Relative** | Get Tag values associated with the channels at the time the Scene was displayed. | | **User Detail** | Get information about the channel that performed the filtered event. | {class="table-col-1-20"} ### Default filtersUse filters to reduce the number of records scanned and results returned. Each Explore includes filters that cannot be removed from the query.
The filter name, [field category](#field-categories), and usage information for the default filters in the Scenes Explore: | Filter name | Field category | Use the filter to... | |-------------|----------------|----------------------| | **Current Project Only** | Query Parameters | Determine which projects are included in the query. Default: **Yes**. To include other projects, 1) select **No**, 2) in the sidebar, select **Query Parameters**, 3) under **Dimensions**, select the filter icon (funnel-simple) next to **Project name**, and 4) in the Filters section, choose which projects to include. | | **Date Range** | Query Parameters | Target events that occurred on a specific date or within a specific date range. | {class="table-col-1-20 table-col-2-20"} ## Building custom queries The following sections walk you through using the Scenes Explore to create custom queries that answer: * How can I identify the users who completed a Scene? * To optimize my Scene, how do I determine which screen is the most relevant and which one generates churn? ### Identify who completed a Scene Follow these steps to get the [Channel IDs](https://www.airship.com/docs/reference/glossary/#channel_id) of the users who viewed all screens in a specific Scene and the number of times they viewed it. First, get the [Push ID](https://www.airship.com/docs/reference/glossary/#push_id) for the Scene you want information about:pushdetail/ in the URL. In this image, the ID is 644dae8d-4ff4-4688-9fe9-e7dac2138ea7:

*Copying the Push ID from the message report URL*Now you are ready to get your data. Select Run, and you should see results similar to the below image. To save your custom query for later access, follow the steps in Saving Performance Analytics queries.
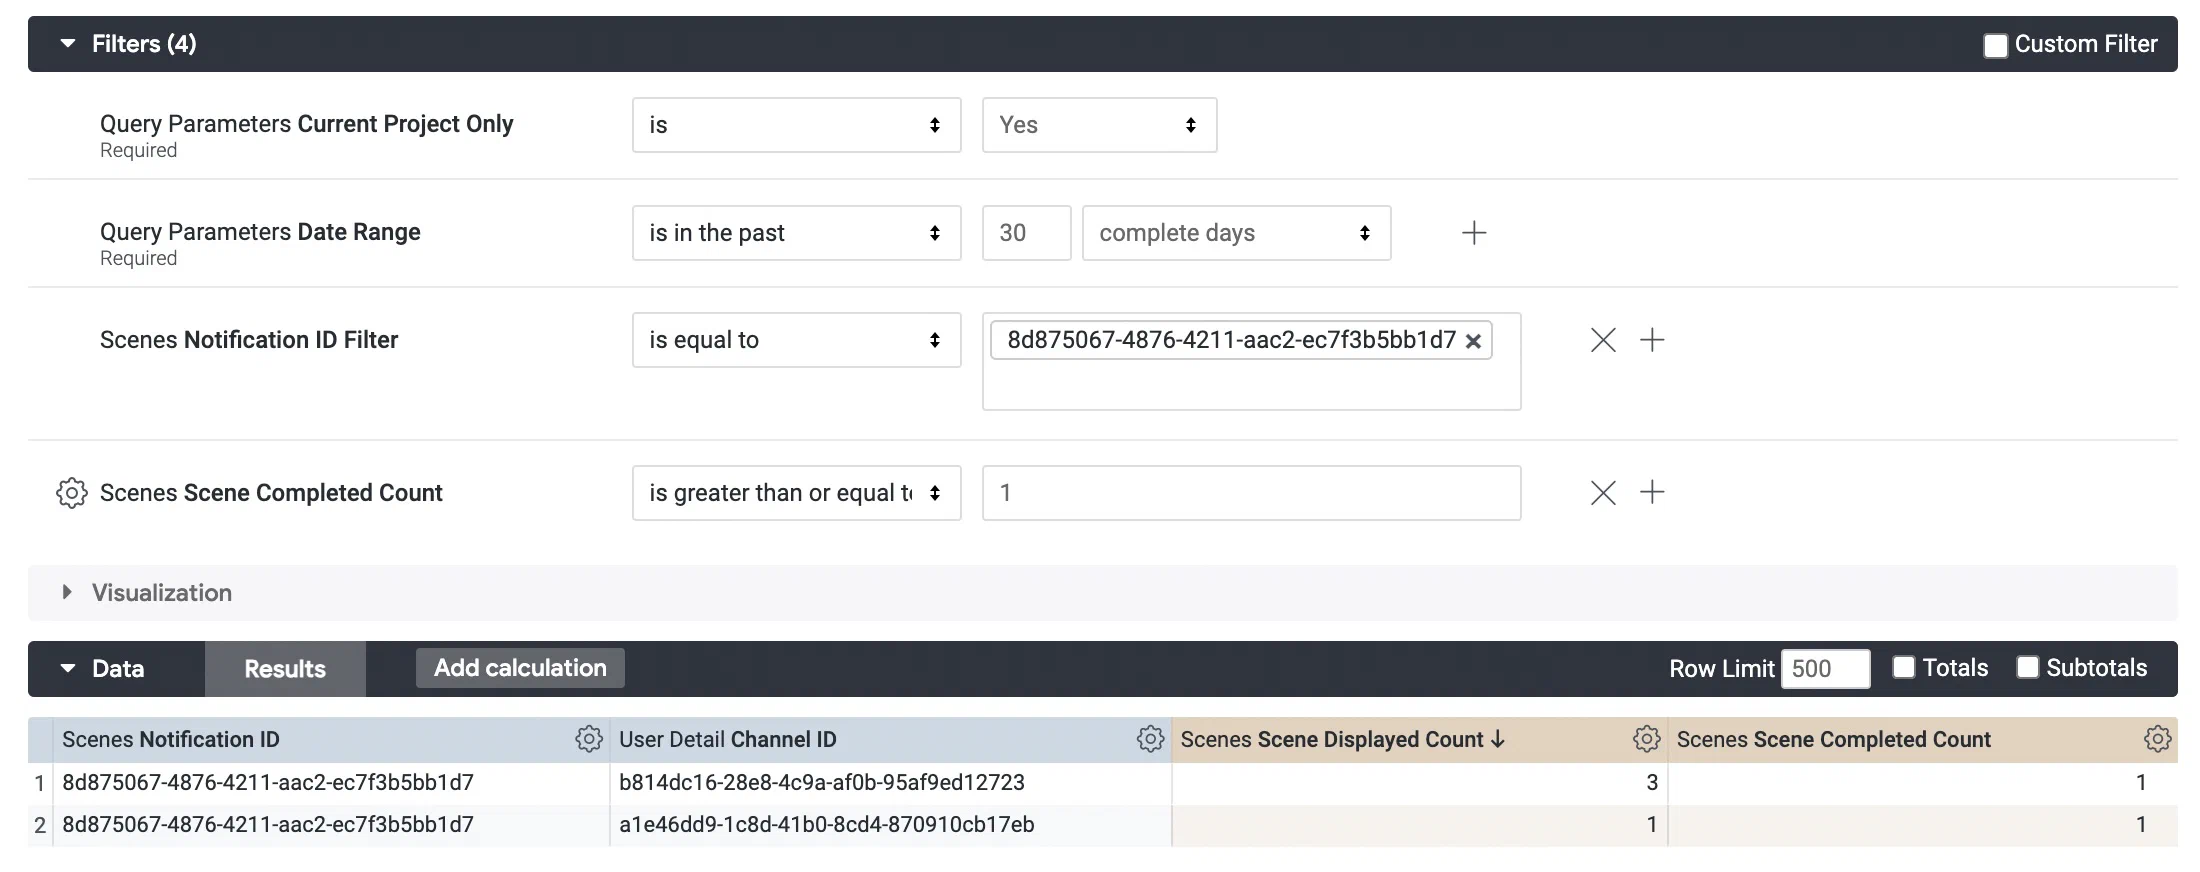 *Using the Scenes Explore to identify who completed a Scene* ### Find relevant screens Follow these steps to identify which screen is the most relevant to users and which generates churn. First, get the [Push ID](https://www.airship.com/docs/reference/glossary/#push_id) for the Scene you want information about:pushdetail/ in the URL. In this image, the ID is 644dae8d-4ff4-4688-9fe9-e7dac2138ea7:

*Copying the Push ID from the message report URL*Data availability depends on your Performance Analytics plan.
## Navigation To access the Explore: 1. Go to **Reports**, then **Performance Analytics**. 1. Select the folder icon (folder-simple), then **Shared**. 1. Under **Looks**, select **Explore Glossary** (**Explore Glossary EUCS** for EU customers). 1. Select **Tag Events**, then **Navigate to Explore**.For a list of all Explores in the glossary, see Predefined Explores in Exploring Performance Analytics data.
## Field categoriesThe sidebar lists categories for various filters, [Dimensions](https://www.airship.com/docs/reference/glossary/#pa_dimension), and [Measures](https://www.airship.com/docs/reference/glossary/#pa_measure) you can use to explore your data. To see their definitions, hover over an item, then select the info icon (ⓘ).
Field categories in the Tag Events Explore: | Category | Description | | --- | --- | | **Query Parameters** | Target all or specific projects, and specify dates and response windows, where relevant. | | **Tag Events** | Set Tag parameters for the query. | | **Tags Current** | Get Tag values associated with the channels at the time the report is run. | | **Tags Relative** | Get Tag values associated with the channels at the time the filtered Tag event occurred. | | **User Detail** | Get information about the channel that performed the filtered event. | | **User Detail - Derived** | Get historical information about the channel that performed the filtered event. | {class="table-col-1-20"} ### Default filtersUse filters to reduce the number of records scanned and results returned. Each Explore includes filters that cannot be removed from the query.
The filter name, [field category](#field-categories), and usage information for the default filters in the Tag Events Explore: | Filter name | Field category | Use the filter to... | |-------------|----------------|----------------------| | **Current Project Only** | Query Parameters | Determine which projects are included in the query. Default: **Yes**. To include other projects, 1) select **No**, 2) in the sidebar, select **Query Parameters**, 3) under **Dimensions**, select the filter icon (funnel-simple) next to **Project name**, and 4) in the Filters section, choose which projects to include. | | **Date Range** | Query Parameters | Target events that occurred on a specific date or within a specific date range. | | **Tag Action Filter** | Tag Events | Return Tags that were set, removed, or either. Use with operator **is**. Select one of: **Add**, **Delete**, **All**. | | **Tag Group Filter** | Tag Events | Specify the [Tag Group](https://www.airship.com/docs/reference/glossary/#tag_group) you want to return tags for. Default: **Notification Opt-in**. Must not be empty. Use with operator **is equal to**. | | **Tag Name Filter** | Tag Events | Return results for specific Tags. Enter Tags by name. Default value: **false**. Default operator: **is equal to**. To return all possible Tags for the filtered Tag Group, select the operator **is not null**. | {class="table-col-1-20 table-col-2-20"} The Tag Action, Group, and Name Filters include non-matched (null) records. To return matched records only, add the Tag Action, Tag Group, and Tag Name Dimensions from the Tag Events field category. ## Building custom queries The following sections walk you through using the Tag Events Explore to create custom queries that answer: * How can I get a list of all the Tags available under a specific Tag Group? How many users had these Tags added over the past 30 days? * How can I get a list of users that had a Tag added after interacting with a button in an [In-App Automation](https://www.airship.com/docs/reference/glossary/#iaa)? ### Get Tags in a Tag Group Follow these steps to get a list of Tags in a Tag Group and the number of users who had the Tag set over the past 30 days. We only need to use the default filters. > **Note:** * This report does not return whether or not users still have the Tag set. To return that data, use the [Audience with Attributes Explore](https://www.airship.com/docs/guides/reports/analytics/exploring/exploring/#predefined-explores). > * If a Tag does not appear for selection in Performance Analytics, it means that no add or remove event has occurred for the Tag during the specified time range. First, [open the Tag Events explore](#navigation), and then configure your query: 1. Set up the filters: 1. Leave **Current Project Only** set to `is Yes`. 1. Set **Date Range** to `is in the last 30 complete days`. 1. Leave **Tag Action** set to `Add`. 1. Set **Tag Group** to the Tag Group you want to return Tags for. 1. Set the **Tag Name** operator to `is not null`. 1. In the sidebar, specify the value and measurement to display: 1. Select **Tag Events**, then select the Dimension **Tag Name**. 1. Select **User Detail**, then select the Measure **User Count**.Now you are ready to get your data. Select Run, and you should see results similar to the below image. To save your custom query for later access, follow the steps in Saving Performance Analytics queries.
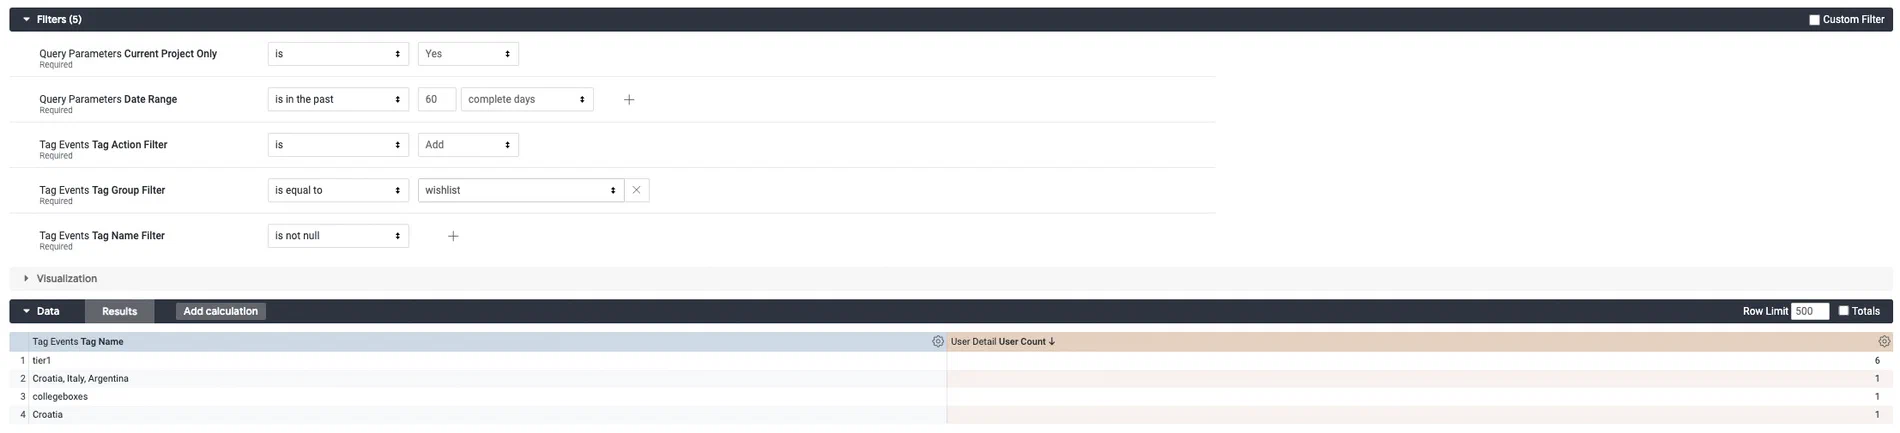 *Creating a custom query from the Tag Events Explore* ### Get Tag adds for button interaction Follow these steps to get a list of users that had a Tag added after interacting with a button in an [In-App Automation](https://www.airship.com/docs/reference/glossary/#iaa). We only need to use the default filters. You must know the name of the Tag for the button interaction. Users will be identified by [Channel ID](https://www.airship.com/docs/reference/glossary/#channel_id). First, [open the Tag Events explore](#navigation), and then configure your query: 1. Set up the filters: 1. Leave **Current Project Only** set to `is Yes`. 1. Set **Date Range** to a range that makes sense for your query. 1. Leave **Tag Action** set to `is Add`. 1. Set **Tag Group** to the Tag Group containing the Tag you want results for. 1. Set the **Tag Name** operator to `is equal to` and select the Tag associated with the button interaction. 1. In the sidebar, specify the value and measurement to display: 1. Select **Tag Events**, then select the Dimension **Tag Name**. 1. Select **User Detail**, then select the Dimension **Channel ID** and Measure **User Count**. If you're using [Named Users](https://www.airship.com/docs/reference/glossary/#named_user) in your project, you can also add the Dimension **Named User** to identify these users in your database. Now you are ready to get your data. Select **Run**, and you should see results similar to the below image. To get count of users, select **Totals** in the **Data** header. To save your custom query for later access, follow the steps in [Saving Performance Analytics queries](https://www.airship.com/docs/guides/reports/analytics/tasks-queries/saving-queries/). 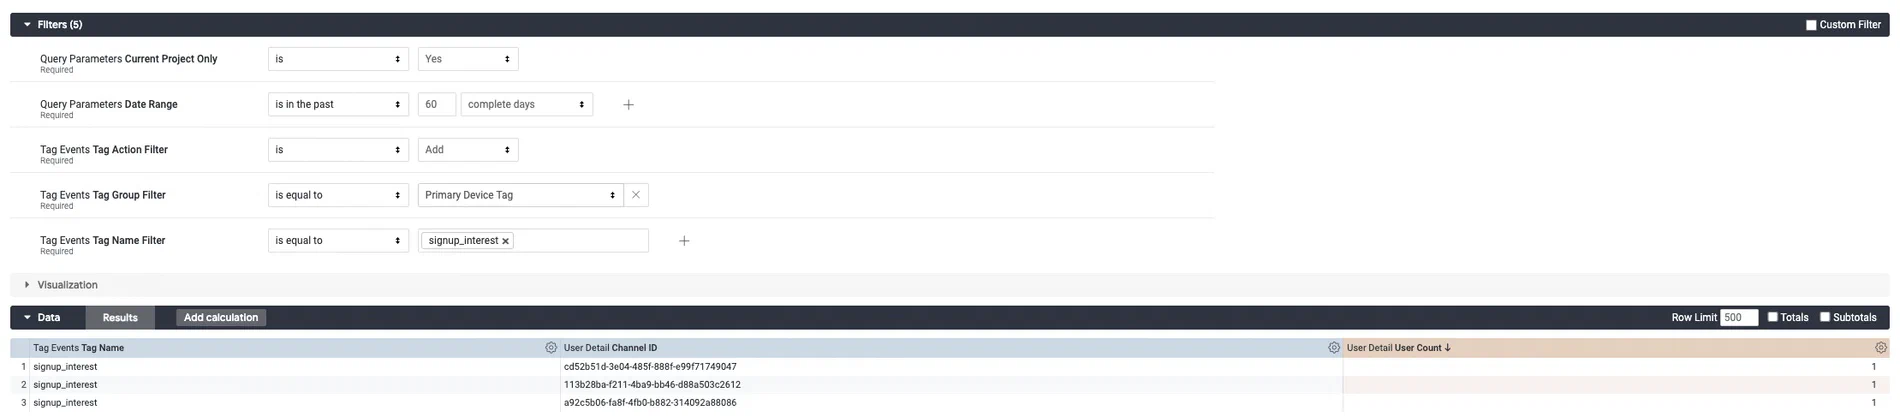 *Creating a custom query from the Tag Events Explore* ### Common tasks and queries Learn how to export lists, report on funnels and paths, and more. # Saving Performance Analytics queries > You can save any query for later access, either as a Look or to a new or existing Dashboard. Start from the [Explore view](https://www.airship.com/docs/guides/reports/analytics/exploring/exploring/#the-explore-view). If you are starting from a Look or Dashboard, hover over the Look, then click the more menu icon (⋮) and select *Explore from here* to open the Explore view. 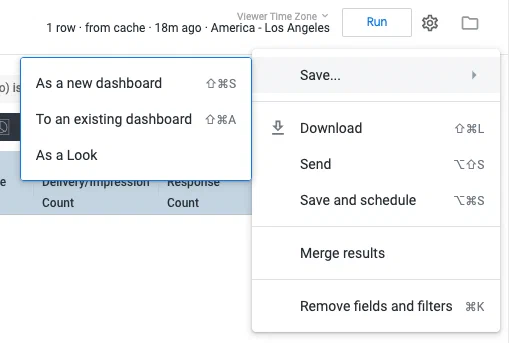 *Saving a query in Performance Analytics* From the Explore view, click the gear icon (⚙), then select *Save as...* and choose a format/location: * *Existing Dashboard* — Enter a title, select a Dashboard, then click **Save to Dashboard**. * *Look* or *New Dashboard* — Enter a title, select a folder, then click **Save** or **Save & View Look**. Folder options: * *My folder* — No one else in your Airship project has access to the content in this folder. * *Group* — Anyone with access to your Airship project and Performance Analytics can access this folder. If you would like to save Looks and Dashboards across multiple projects, use this folder. # Scheduling delivery of Performance Analytics data > Export your Performance Analytics data single time or at repeated intervals using various methods, formats, and other options. > **Important:** **Best Practice** > > Since Performance Analytics is an on-demand system, it is important that your > scheduled requests do not adversely impact other customers. When scheduling an > export of user-level data: > > 1. Filter appropriately so that results are not excessive or a larger data > set than necessary. > 1. Select a weekend day to limit your impact on other users. > > If you are interested in integrating with other business systems, we highly > recommend using our > [Real-Time Data Streaming](https://www.airship.com/docs/reference/glossary/#rtds) > integrations, which will scale to your needs. See: > [Integrations](https://www.airship.com/docs/integrations/). > > --- > > **Excessive Exports** > > Event data, such as messages, clicks, and tag events, is updated about every hour, depending on the volume of data. Channel state data, such as tags and attributes associated to a channel, is updated every night. Any scheduled data exports exceeding these time frames will be considered excessive and could be removed. ## Scheduling Look Delivery You can only schedule delivery of saved Looks. If you edited a Look and want to schedule delivery, first save it as a new Look, then complete these steps. Refer to [Scheduling Options](#scheduling-options) below for detail. From a Look: 1. Hover over the Look, then click the more menu icon (⋮) and select *Schedule*. 1. Enter a name for the schedule. 1. Select and configure the destination: * *Email* — Your account's email address is populated by default. For each additional recipient, enter the email address and **click Add**. You can also include a custom message that will appear above the data in the email. * *Webhook* — Enter the webhook URL. * *Amazon S3* — Enter the S3 values for the bucket and optional path, access key, and secret key, then select a region. * *SFTP* — Enter the host address, e.g., *sftp://example.com/home/ftpuser/*, and the SFTP user username and password, then select your preferred key exchange algorithm. 1. Select a data format. 1. Set the recurrence interval, or select *Datagroup update* and select a datagroup. 1. (Optional) Edit or configure *Filters*: Specify the date range and project name and add more filters. 1. (Optional) Configure *Advanced options*. These options control the delivery logic based on data presence and changes, limits on output, visual output, paper size, and time zone. 1. (Optional) Click **Send Test** to preview before saving. It will send according to the current settings. 1. Click **Save All**. ## Scheduling Dashboard Delivery Refer to [Scheduling Options](#scheduling-options) below for detail. From a Dashboard: 1. Click the more menu icon (⋮) and select *Schedule delivery*. 1. Configure the *Settings* tab: 1. Enter a name for the schedule. 1. Set the recurrence interval, or select *Datagroup update* and select a datagroup. 1. Select and configure the destination: * *Email* — Your account's email address is populated by default. For each additional recipient, enter the email address and hit Enter or click outside the field. * *Webhook* — Enter the webhook URL. * *Amazon S3* — Enter the S3 values for the bucket and optional path, access key, and secret key, then select a region. * *SFTP* — Enter the host address, e.g., *sftp://example.com/home/ftpuser/*, and the SFTP user username and password, then select your preferred key exchange algorithm. 1. Select a data format. Available options depend on your selected destination and whether you are scheduling a Look or a Dashboard. 1. (Optional) Edit or configure the *Filters* tab: Specify the date range and project name and add more filters. 1. Configure the *Advanced options* tab. These options control the visual output, paper size, and time zone. 1. Click **Save now**. ## Scheduling Options These options are available when configuring scheduling. ### Destinations * *Email* — The data is delivered to the email addresses entered. * *Webhook* — Webhooks are a modern, increasingly common way to trigger exchanges between internet based services. They generally require some technical or developer knowledge to use, but with a product like [Zapier](https://zapier.com/), webhooks can let Performance Analytics data be delivered to a wide range of locations. Only a webhook URL is required. * *Amazon S3* — Amazon S3 buckets are a common way to store large amounts of data. Options include: * *Limits* — If you choose "Results in Table", whatever row limitations you've set up in the saved Look will be obeyed. If you choose "All Results" all the rows of the query will return, regardless of the saved Look settings, and regardless of the typical 5,000 row limit for Performance Analytics. This can be desirable for retrieving very large datasets, but you should use caution to ensure the query is not too large for your database. * *SFTP* — The data is uploaded according to your server. ### Formats Dashboards support these output formats: * CSV * PDF * PNG visualization For Looks, supported formats depend on the destination: | Format | Email | Webhook | S3 | SFTP | | --- | :---: | :---: | :---: | :---: | | CSV | ✓ | ✓ | ✓ | ✓ | | Text | ✓ | ✓ | ✓ | ✓ | | XLSX | ✓ | ✓ | ✓ | ✓ | | JSON — Simple | ✓ | ✓ | ✓ | ✓ | | HTML | ✓ | | ✓ | ✓ | | JSON — Detailed, Inline | | ✓ | ✓ | ✓ | | JSON — Simple, Inline | | ✓ | | | | JSON - Label | | ✓ | | | | Data Table1 | ✓ | | | | | Visualization1 | ✓ | | | | 1. Sent in the body of the email. # Add Web Metrics To a Report > Add web metrics to a report. Add web push notification metrics to the *Message Report by Platform* report, and save the customized version in your Personal or Group space. 1. Go to *Reports » Performance Analytics*. 1. Go to any report or dashboard. 1. Click the grid icon (squares-four), click the globe icon (globe), and then go to *Messages » Message Report by Platform*. 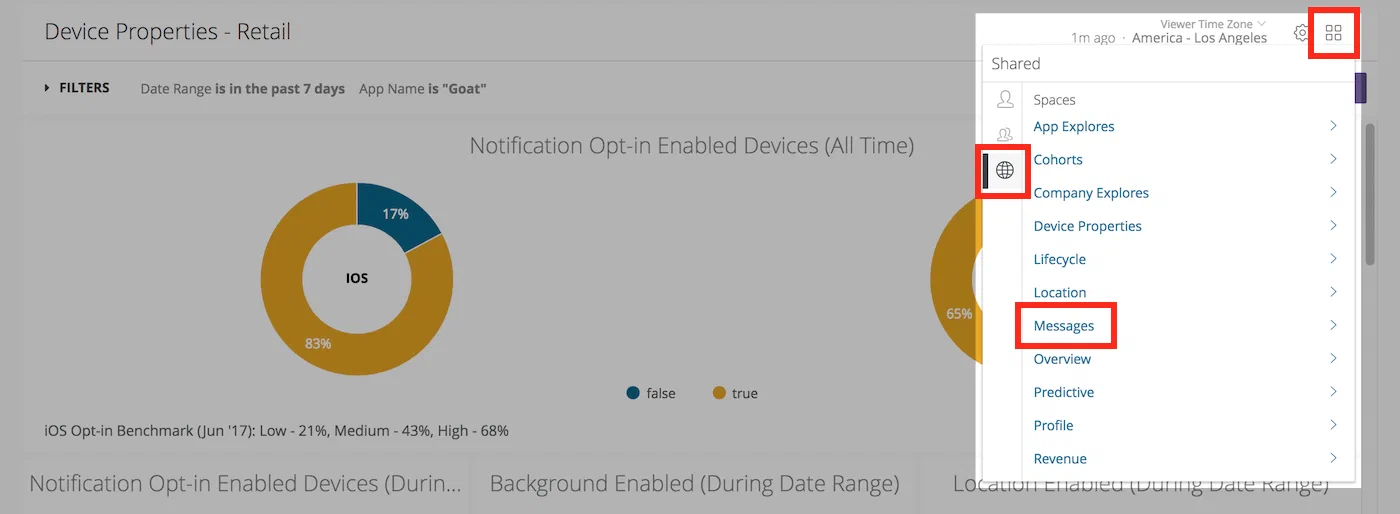 *Navigating to the Message Report by Platform Look* 1. Click the gear icon (⚙) and select *Explore from Here*. 1. In *Filters*, set *Message Type* to `Web Notification`. 1. From the left side menu, in *Messaging Metrics » Measures » Web Metrics*, click the rows for: * Web Click Rate * Web Click Count * Web Session Rate * Web Session Count 1. Click the gear icon (⚙) and select *Save as a Look*. 1. Enter a *Title* and *Description*, select the *Personal* or *Group* space, then click **Save** or **Save & View Look**. # Export Lists > Learn the general process of exporting Performance Analytics data and review specific examples. All data in Performance Analytics can be exported in a number of formats via the download feature. In this document we'll look at the general process of exporting Performance Analytics data, then we'll examine the specific example of exporting a list of users that have directly opened a notification or rich message. In this tutorial, you will first learn how to export report data, then follow steps to export specific types of report data. ## Export Data In this section we look at the general process of exporting Performance Analytics data. 1. Go to *Reports » Performance Analytics*. 1. Select a dashboard and find the report you would like to download. 1. If you are on a default dashboard, click the more menu icon (⋮) and select *Download Data...*. If you clicked the tile to open the report or opened the report from a Space, instead click **Download Results**. 1. Specify Download Options: * **File Format:** The format of the download: *TXT*, *Excel Spreadsheet*, *CSV*, *JSON*, *HTML*, *Markdown*, or *PNG (Image of Visualization)*. * **Results:** *With visualization options applied* or *As displayed in the data table*. * **Values:** *Unformatted* means special characters are truncated from values, and values will be rounded to the nearest integer, e.g., "1.13%" is rounded to "1%". As a general rule, the *Unformatted* option is good for discrete values, e.g., a count of devices, while *Formatted* is a good option for non-discrete values, such as percentages. * **Limit:** *Results in Table* exports all results currently visible in the table. *All Results* exports every result fetched by the query. Select *Custom*, to define a cutoff row for the download, e.g., enter *5000* to download of the first 5,000 records. * **Filename:** Enter a descriptive filename. 1. Click **Download** and save the file. If you'd like to view the data in the browser instead, click **Open in Browser**, and it will open in a new browser tab. ## Notifications Generate a list of users that directly opened a specific push notification. 1. Go to *Reports » Performance Analytics*. 1. Select the *Revenue* dashboard. 1. In the *Messages* report, locate the row for the message you want to analyze, then click its value in the *Direct Response Count* column. 1. Download the data as described in [Export Data](#export-data). ## Rich Pages Generate a list of users that directly opened a specific rich message. 1. **Go to the Messages dashboard.** 1. In the *Top 50 Rich App Pages* report, **locate the row for the Message you want to analyze**, then **click its value in the *Read Count* column.** 1. **Click the arrow next to Filters to display the full menu.** 1. **Edit the Rich Pushes Occurred Date range**, and set the value of *is on or after* to the day before the message send date: 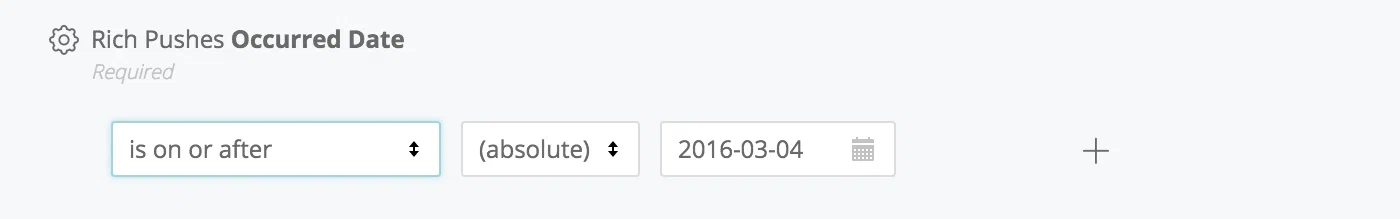 *Setting the Rich Pushes Occurred Date filter* This configuration is necessary to ensure you capture rich message reads occurring in every time zone. 1. **Click the Run button** to refresh the query. 1. **Download the data** as described in [Export Audience Lists](#export-audience-list). ## Ad IDs {#ins-tutorial-ad-ids} Generate a list of Ad IDs for users that made a purchase. Please visit our [Ad IDs topic guide](https://www.airship.com/docs/guides/audience/ad-ids/) for use cases and technical details. > **Warning:** Your app must: > > 1. Send the *limit ad tracking* field from your app, and > 1. Not target users with ads who have *limit ad tracking* enabled. A value of > Unknown or Limit Ad Tracking = Yes or Unknown means you cannot send > ads to these users. 1. Go to *Reports » Performance Analytics*. 1. Select the *Revenue* dashboard. 1. In the *Custom Events Table* report, locate the *purchased* row and click its value in the *Event Count* column. 1. Click **Explore from Here**. 1. Make these changes in the left side menu: * In *Custom Events » Dimensions*, click the row for *Platform*. * In *User IDs » Dimensions*, click the row for *Device ID* to unselect it, and click the row for *Ad ID*. * Click **Filter** for *Limit Ad Tracking Enabled* to add the row to the Filters menu, then set the value of *is equal to* to "No." 1. Download the data as described in [Export Data](#export-data). 1. (Optional) Create a custom audience on Facebook. Follow [Facebook's instructions: Create a Customer List Custom Audience](https://www.facebook.com/business/help/170456843145568?id=2469097953376494) to create a Custom Audience or Lookalike Audience using the downloaded file. File must be in TXT or CSV format. ## Export Audience Lists {#export-audience-list} You can [segment your audience](https://www.airship.com/docs/guides/audience/segmentation/segmentation/) using an [Uploaded List](https://www.airship.com/docs/reference/glossary/#uploaded_list). First, follow these steps to download a CSV of device identifiers. Second, [upload the list of users](https://www.airship.com/docs/guides/audience/segmentation/audience-lists/uploaded/##uploading-your-list) to your project, using the file you just downloaded. This example downloads all your Daily Active Users, 1. Go to *Reports » Performance Analytics*. 1. Select the *Overview* dashboard. 1. In the *Daily Active Users* report, click its value. 1. Click **Explore from Here**. 1. Download the data as described in [Export Data](#export-data), using these values: * **File Format**: CSV * **Values**: Unformatted * **Limit**: All Results # Find In-App Impression Rate > Finding your in-app impression rate. To find the in-app impression rate, we need to add two Measures to the Messages Look.