# Custom queries and reference for the Scenes Explore

Use the Scenes Explore to analyze the performance of your Scenes and the relevance of each screen.

Access history related to [Scene](https://www.airship.com/docs/reference/glossary/#scene) <!--adds and removals, get Tag values at the time of Tag-related events, and get information about channels associated with specific Tags and/or Tag events.-->

<p>Data availability depends on your <a href="https://www.airship.com/docs/reference/feature-packages/#data">Performance Analytics plan</a>.</p>

## Navigation

To access the Explore:

1. Go to **Reports**, then **Performance Analytics**.
1. Select the folder icon (
), then **Shared**.
1. Under **Looks**, select **Explore Glossary** (**Explore Glossary EUCS** for EU customers).
1. Select **Scenes**, then **Navigate to Explore**.

<p>For a list of all Explores in the glossary, see <a href="https://www.airship.com/docs/guides/reports/analytics/exploring/exploring/#predefined-explores">Predefined Explores</a> in <em>Exploring Performance Analytics data</em>.</p>

## Field categories

<p>The sidebar lists categories for various filters, [Dimensions](https://www.airship.com/docs/reference/glossary/#pa_dimension), and [Measures](https://www.airship.com/docs/reference/glossary/#pa_measure) you can use to explore your data. To see their definitions, hover over an item, then select the &ldquo;i&rdquo; icon (
).</p>

Field categories in the Scenes Explore:

<div class="table-scroll-wrapper">
<table width="100%" class="reference-table">
  <col style="width:20%">
  <col style="width:80%">
<thead>
  <tr>
    <th>Category</th>
    <th>Description</th>
   </tr>
</thead>
<tbody>
  <tr><td>Attributes Current</td>
<td>Get Attribute values associated with the channels at the time the report is run.</td></tr>
  <tr>
    <td>Attributes Relevant</td>
    <td>Get Attribute values associated with the channels at the time the Scene was displayed.</td>
  </tr>
  <tr><td>Device Properties Current</td>
<td>Get device property values associated with the channels at the time the report is run.</td></tr>
  <tr>
    <td>Device Properties Relative</td>
    <td>Get device property values associated with the channels at the time the Scene was displayed.</td>
  </tr>
  <tr><td>Query Parameters</td>
<td>Target all or specific projects, and specify dates and response windows, where relevant.</td></tr>
  <tr>
    <td>Scenes</td>
    <td>Set Scene parameters for the query. Includes survey-related data if NPS or Questions are included in a Scene.</td>
  </tr>
  <tr>
    <td>Survey</td>
    <td>Set Survey parameters for the query. Does not include data from Scenes.</td>
  </tr>
  <tr><td>Tags Current</td>
<td>Get Tag values associated with the channels at the time the report is run.</td></tr>
  <tr>
    <td>Tags Relative</td>
    <td>Get Tag values associated with the channels at the time the Scene was displayed.</td>
  </tr>
  <tr><td>User Detail</td>
<td>Get information about the channel that performed the filtered event.</td></tr>
</tbody>
</table>
</div>

### Default filters

<p>Use filters to reduce the number of records scanned and results returned. Each Explore includes filters that cannot be removed from the query.</p>

The filter name, [field category](#field-categories), and usage information for the default filters in the Scenes Explore:

<div class="table-scroll-wrapper">
<table width="100%" class="reference-table">
  <col style="width:20%">
  <col style="width:20%">
  <col style="width:60%">
<thead>
  <tr>
    <th>Filter name</th>
    <th>Field category</th>
    <th>Use the filter to...</th>
  </tr>
</thead>
<tbody>
  <tr><td>Current Project Only</td>
<td>Query Parameters</td>
<td>
  Determine which projects are included in the query. Default selection: <b>Yes</b>. To include other projects within your company, select <b>No</b>, then:
    <ol>
      <li>
        In the sidebar, select <b>Query Parameters</b>.
      </li>
      <li>
        Under <b>Dimensions</b>, select the filter icon (
) next to <b>Project name</b>.
      </li>
      <li>In the Filters section, select the entry field next to the Project Name filter and choose which projects to include.
      </li>
    </ol>
</td></tr>
  <tr><td>Date Range</td>
<td>Query Parameters</td>
<td>Target events that occurred on a specific date or within a specific date range.</td></tr>
</tbody>
</table>
</div>

## Building custom queries

The following sections walk you through using the Scenes Explore to create custom queries that answer:

* How can I identify the users who completed a Scene?
* To optimize my Scene, how do I determine which screen is the most relevant and which one generates churn?

### Identify who completed a Scene

Follow these steps to get the [Channel IDs](https://www.airship.com/docs/reference/glossary/#channel_id) of the users who viewed all screens in a specific Scene and the number of times they viewed it.

First, get the [Push ID](https://www.airship.com/docs/reference/glossary/#push_id) for the Scene you want information about:

<ol>
<li>Go to <strong>Messages</strong>, then <strong>Messages Overview</strong>.</li>
<li>Search for an active or stopped Scene.</li>
<li>If the list is in collapsed view, hover over the Scene and select the report icon (
) to open its message report. If in expanded view, select <strong>
 Report</strong>.</li>
<li>Copy the Push ID from the address bar. The ID follows <code>pushdetail/</code> in the URL. In this image, the ID is <code>644dae8d-4ff4-4688-9fe9-e7dac2138ea7</code>:
![Copying the Push ID from the message report URL](https://www.airship.com/docs/images/pa-push-id_hu_ab530624fbe8130e.webp)
   
   *Copying the Push ID from the message report URL*</li>
</ol>

Next, [open the Scenes explore](#navigation), and then configure your query:

1. Set up the filters:
   1. Leave **Current Project Only** set to `is Yes`.
   1. Set **Date Range** to the range you are interested in.
   1. Select ** Add Filter**, then **Scenes**, then **Notification ID**, and paste the Push ID for your Scene.
   1. Select ** Add Filter**, then **Scenes**, then **Scene Completed Count**, and set the value to `is >= 1` (greater than or equal to one).
1. In the sidebar, specify the values and measurements to display:
   1. Select **Scenes**, then select the Dimension **Notification ID**.
   1. Select **User Detail**, then select the Dimension **Channel ID**.
   1. Select **Scenes**, then select the Measures **Scene Displayed Count** and **Scene Completed Count**. 
   
<p>Now you are ready to get your data. Select <strong>Run</strong>, and you should see results similar to the below image. To save your custom query for later access, follow the steps in <a href="https://www.airship.com/docs/guides/reports/analytics/tasks-queries/saving-queries/">Saving Performance Analytics queries</a>.</p>

![Using the Scenes Explore to identify who completed a Scene](https://www.airship.com/docs/images/explore-scenes-completed_hu_c52f0fa2f3192abb.webp)

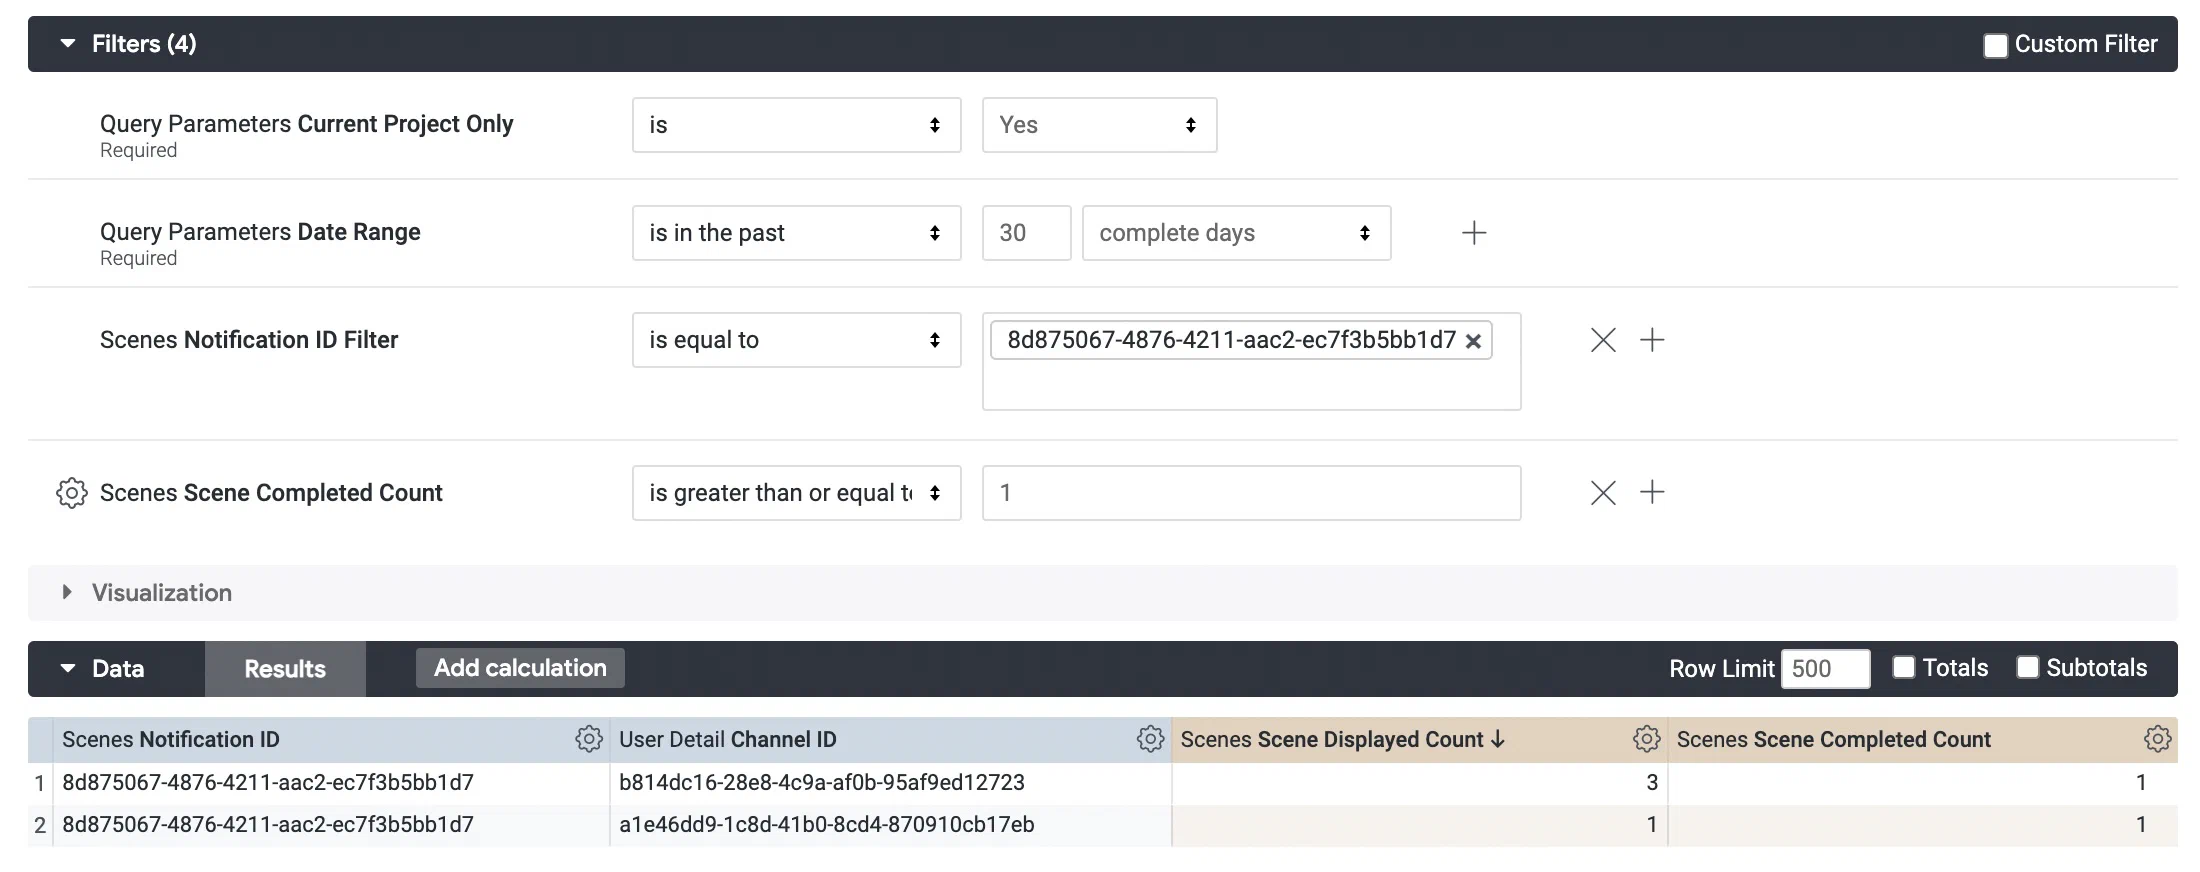
*Using the Scenes Explore to identify who completed a Scene*

### Find relevant screens

Follow these steps to identify which screen is the most relevant to users and which generates churn. 

First, get the [Push ID](https://www.airship.com/docs/reference/glossary/#push_id) for the Scene you want information about:

<ol>
<li>Go to <strong>Messages</strong>, then <strong>Messages Overview</strong>.</li>
<li>Search for an active or stopped Scene.</li>
<li>If the list is in collapsed view, hover over the Scene and select the report icon (
) to open its message report. If in expanded view, select <strong>
 Report</strong>.</li>
<li>Copy the Push ID from the address bar. The ID follows <code>pushdetail/</code> in the URL. In this image, the ID is <code>644dae8d-4ff4-4688-9fe9-e7dac2138ea7</code>:
![Copying the Push ID from the message report URL](https://www.airship.com/docs/images/pa-push-id_hu_ab530624fbe8130e.webp)
   
   *Copying the Push ID from the message report URL*</li>
</ol>

Next, [open the Scenes explore](#navigation), and then configure your query:

1. Set up the filters:
   1. Leave **Current Project Only** set to `is Yes`.
   1. Set **Date Range** to the range you are interested in.
   1. Select ** Add Filter**, then **Scenes**, then **Notification ID**, and paste the Push ID for your Scene.
1. In the sidebar, specify the value and measurements to display:
   1. Select **Scenes**, then select the Dimension **Screen Number**.
   1. Select **Scenes**, then select the Measures **Screen View Count** and **Per Notification Rates: Button Tap Rate**.  

![Setting the calculation method for Button Tap Rate](https://www.airship.com/docs/images/explore-scenes-relevant-screens-calculation_hu_4d886883063000b3.webp)

*Setting the calculation method for Button Tap Rate*

Next, select **Run** to get your data, then select the gear icon () in the header of the **Button Tap Rate** column, then **Calculations**, then **% of column**. This sets the value to the percentage of views per screen.

As a final step, you can personalize the visualization in order to highlight the percentage of displays per screen and the percentage of engagement per screen. This can help you to quickly identify the impact of each screen of your Scene. Select an icon in the Visualization section header and hover over an icon to see its label. You may need to select the more menu icon () to expose all options. Select <b>Edit</b> for options specific to the current format. Some Visualization types may be incompatible with the currently selected Dimensions and Measures. The image below shows the report with the Column visualization selected.

![Using the Scenes Explore to find a Scene's relevant screens](https://www.airship.com/docs/images/explore-scenes-relevant-screens_hu_b1b36278af312ba1.webp)

*Using the Scenes Explore to find a Scene's relevant screens*

To save your custom query for later access, follow the steps in [Saving Performance Analytics queries](https://www.airship.com/docs/guides/reports/analytics/tasks-queries/saving-queries/).