Selections made here are immediately reflected in the Filters and Data sections. Separate tabs show All Fields and fields that are in use for the current query. | | **Filters** | Use this section to configure the filters in the query.
You add filters by selecting the filter icon (funnel-simple) for a Measure or Dimension in the sidebar. Select the add icon (+) or the remove icon (×) in a filter row to add or remove filters of the same type. Multiple filters of the same type are processed as a boolean OR.
The default value for the App Name filter is the current Airship project name. Operators and input support vary by field. For example a time dimension supports setting a time range, and text dimensions return matching values as you type.
To manually add filtering expressions, select the box for **Custom Filter** to expose the entry field.
Select **Run** after making changes. Only rows for which conditions are true will be returned in results. | | **Visualization** | The Explore view opens to a default visualization format, one of Table, Column, Bar, Scatterplot, Line, Area, Pie, Map, Single Value, Static Map (Regions), Static Map (Points), Donut Multiples, or Single Record.
To view the data in another format, select an icon in the Visualization section header. Hover over an icon to see its label. You may need to select the more menu icon (⋯) to expose all options. Select **Edit** for options specific to the current format. *The Visualization section header in the Explore view*Some Visualization types may be incompatible with the currently selected Dimensions and Measures. | | **Data** | This section is essentially the Table visualization format. You can set the maximum number of rows to return and whether or not to display totals. *The Data section header in the Explore view* See also [Saving Queries](https://www.airship.com/docs/guides/reports/analytics/tasks-queries/saving-queries/). | {class="table-col-1-20"} > **Tip:** You can bookmark queries in your web browser after opening the Explore view in a new window: > > * From a Look, hover and select the more menu icon (⋮), then hold down **Ctrl** (Windows) or **Command ⌘** (Mac) on your keyboard and select **Explore from here**. > * From the [Explore glossary](#predefined-explores), select the more menu icon (⋯) next to its name and select **Navigate to Explore**. > > Use your browser’s bookmark feature to save the view. ## Example data exploration Let's find your app's in-app impression rate. To do this we need to add two Measures to the Messages Look.
Data availability depends on your Performance Analytics plan.
## Navigation To access to the Explore: 1. Go to **Reports**, then **Performance Analytics**. 1. Select the folder icon (folder-simple), then **Shared**. 1. Under **Looks**, select **Explore Glossary** (**Explore Glossary EUCS** for EU customers). 1. Select **Audience with Attributes**, then **Navigate to Explore**.For a list of all Explores in the glossary, see Predefined Explores in Exploring Performance Analytics data.
## Field categoriesThe sidebar lists categories for various filters, [Dimensions](https://www.airship.com/docs/reference/glossary/#pa_dimension), and [Measures](https://www.airship.com/docs/reference/glossary/#pa_measure) you can use to explore your data. To see their definitions, hover over an item, then select the info icon (ⓘ).
Field categories in the Audience with Attributes Explore: | Category | Description | | --- | --- | | **Attributes** | Set Attribute parameters for the query. | | **Device Properties** | Get device property values associated with the channels at the time the report is run. | | **Query Parameters** | Target all or specific projects, and specify dates and response windows, where relevant. | | **Report Over Time** | Add filters and Dimensions to report historical data. | | **Tags** | Get Tag values associated with the channels at the time the report is run. | | **User Detail** | Get information about the channel that performed the filtered event. | {class="table-col-1-20"} ### Default filtersUse filters to reduce the number of records scanned and results returned. Each Explore includes filters that cannot be removed from the query.
The filter name, [field category](#field-categories), and usage information for the default filters in the Audience with Attributes Explore: | Filter name | Field category | Use the filter to... | |-------------|----------------|----------------------| | **Current Project Only** | Query Parameters | Determine which projects are included in the query. Default: **Yes**. To include other projects, 1) select **No**, 2) in the sidebar, select **Query Parameters**, 3) under **Dimensions**, select the filter icon (funnel-simple) next to **Project name**, and 4) in the Filters section, choose which projects to include. | | **Current Audience Only** | Report Over Time | Determine whether or not to return your audience's current values only. Default: **Yes**. Select **No** to also return historical values. | {class="table-col-1-20 table-col-2-20"} ## Building custom queries The following sections walk you through using the Audience with Attributes Explore to create custom queries that answer: * How many mobile users can I reach with a [Push Notification](https://www.airship.com/docs/reference/glossary/#push_notification)? And how many with Email or SMS? Is my audience growing? * Within a [Tag Group](https://www.airship.com/docs/reference/glossary/#tag_group), which Tag do users subscribe to the most? Among these users, how many opted out of push notifications? ### Determine audience reach and growth Follow these steps to view historical user counts you can use to analyze your audience evolution. You can filter by Tag, Attribute, or Device Property. In our example, we add the Device Property Filter for notification opt-ins. User counts are listed per platform. First, [open the Audience with Attributes explore](#navigation), and then configure your query: 1. Set up the filters: 1. Leave **Current Project Only** set to `is Yes`. 1. Set **Current Audience Only** to `is No`. 1. In the sidebar, select **Report Over Time**, then the filters **Number of Days, Weeks or Months to Report** and **Report over time by Day, Week, or Month**. > **Tip:** Instead of navigating to filters, Dimensions, and Measures, you can find them using the search box at the top of the sidebar. 1. Set the **Number of...** and **Report over time...** filters to the period of time you want to query. 1. In the sidebar, select **Device Properties**, then **Notification Opt-in Filter**. 1. Set **Notification Opt-in Filter** to `is not null`. 1. 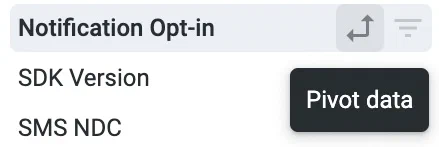 *Selecting the option to pivot data* In the sidebar, specify the values and measurement to display: 1. Select **Report Over Time**, then select the Dimension **Date** or **Month**. Our example uses **Date**. 1. Select **User Detail**, then select the Dimension **Platform**, then select the double-arrow icon next to **Platform**. The pivot option adds detailed metrics for each platform and makes it more readable. It can be helpful when using the Graph visualization. 1. Select **User Detail**, then select the Measure **User Count**.Now you are ready to get your data. Select Run, and you should see results similar to the below image. To save your custom query for later access, follow the steps in Saving Performance Analytics queries.
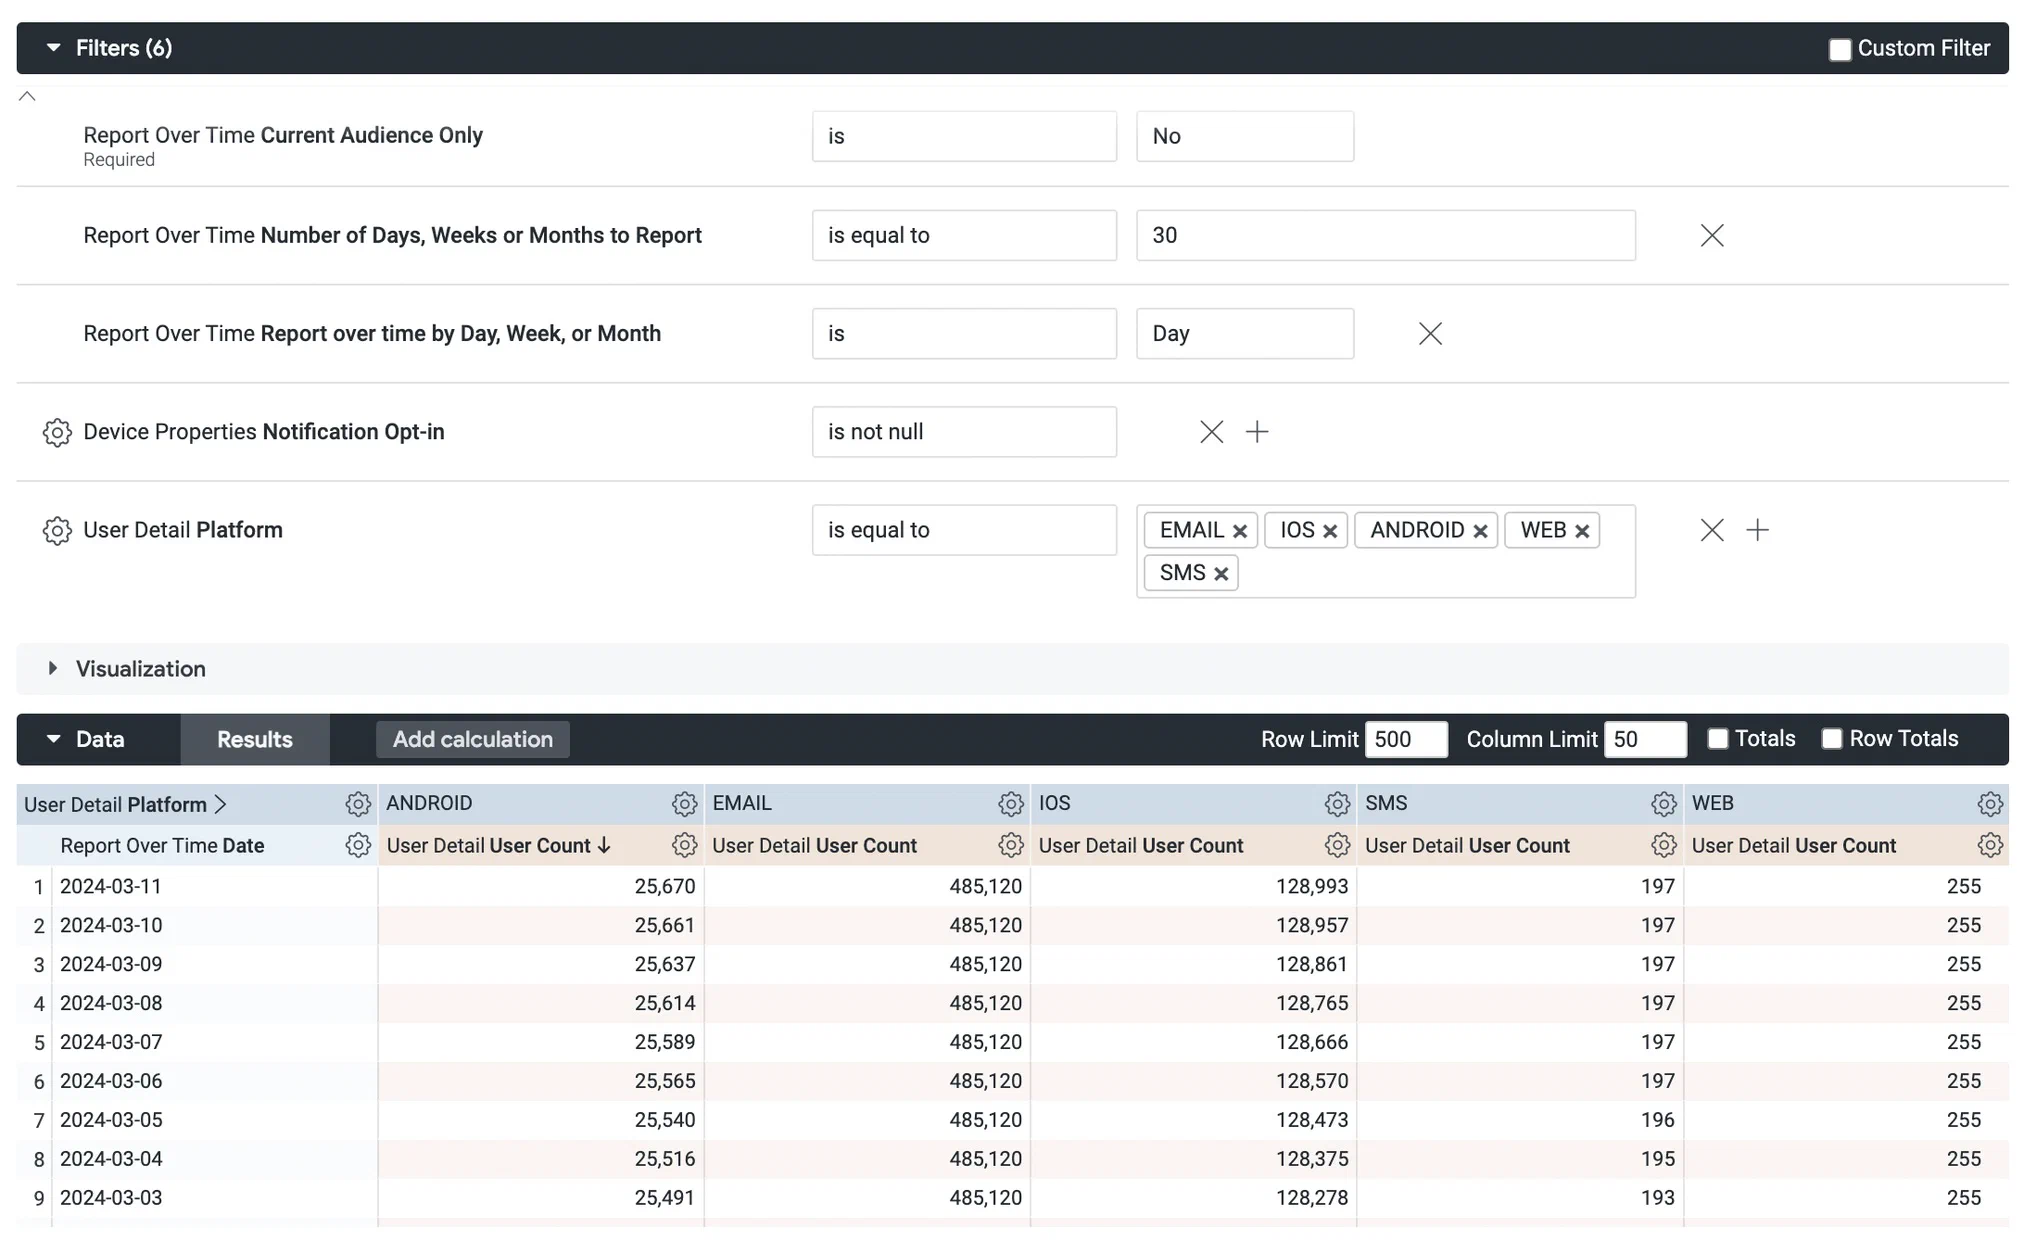 *Creating a custom query from the Audience with Attributes Explore* ### Find Tags and opt-outs Follow these steps to find which Tags in a Tag Group users subscribe to the most and how many opted out of push notifications. First, [open the Audience with Attributes explore](#navigation), and then configure your query: 1. Set up the filters: 1. Leave **Current Project Only** set to `is Yes`. 1. Leave **Current Audience Only** set to `is Yes`. 1. In the sidebar, select **Device Properties**, then **Notification Opt-in Filter**. 1. Set **Notification Opt-in Filter** to `is not null`. 1. In the sidebar, select **Tags**, then **#1 Tag Group Filter**. Then set it to `is equal to` and enter the name of the Tag Group you want to return Tags for. 1. (Optional, to return specific tags in the filtered Tag Group) In the sidebar, select **Tags**, then **#1 Tag Name Filter**. Then set it to `is equal to` and enter the names of Tags in the Tag Group. 1. In the sidebar, specify values and measurements to display: 1. Select **Tags**, then select the Dimensions **#1 Tag Group** and **#1 Tag Name**. 1. Select **User Detail**, then select the Measure **User Count**. 1. 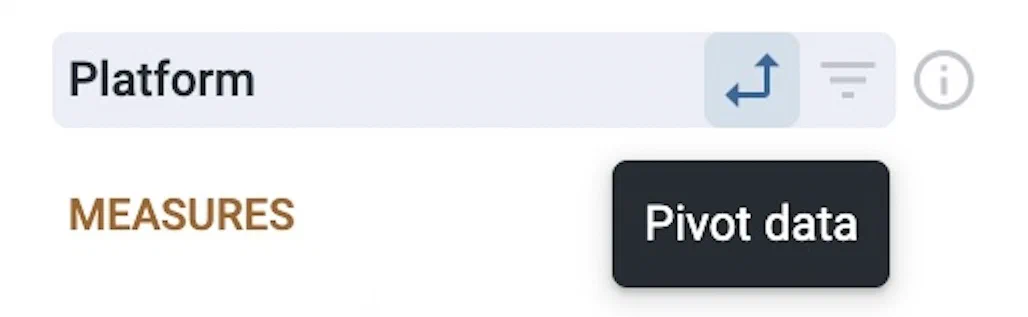 *Selecting the option to pivot data* Select **Device Properties**, then select the Dimension **Notification Opt-in**, then select the double-arrow icon next to **Notification Opt-in**. The pivot option adds detailed metrics for each platform and makes it more readable. 1. In the **Data** header, select the **Row Totals** check box to display the sum of opted in and opted out channels that have each Tag.Now you are ready to get your data. Select Run, and you should see results similar to the below image. To save your custom query for later access, follow the steps in Saving Performance Analytics queries.
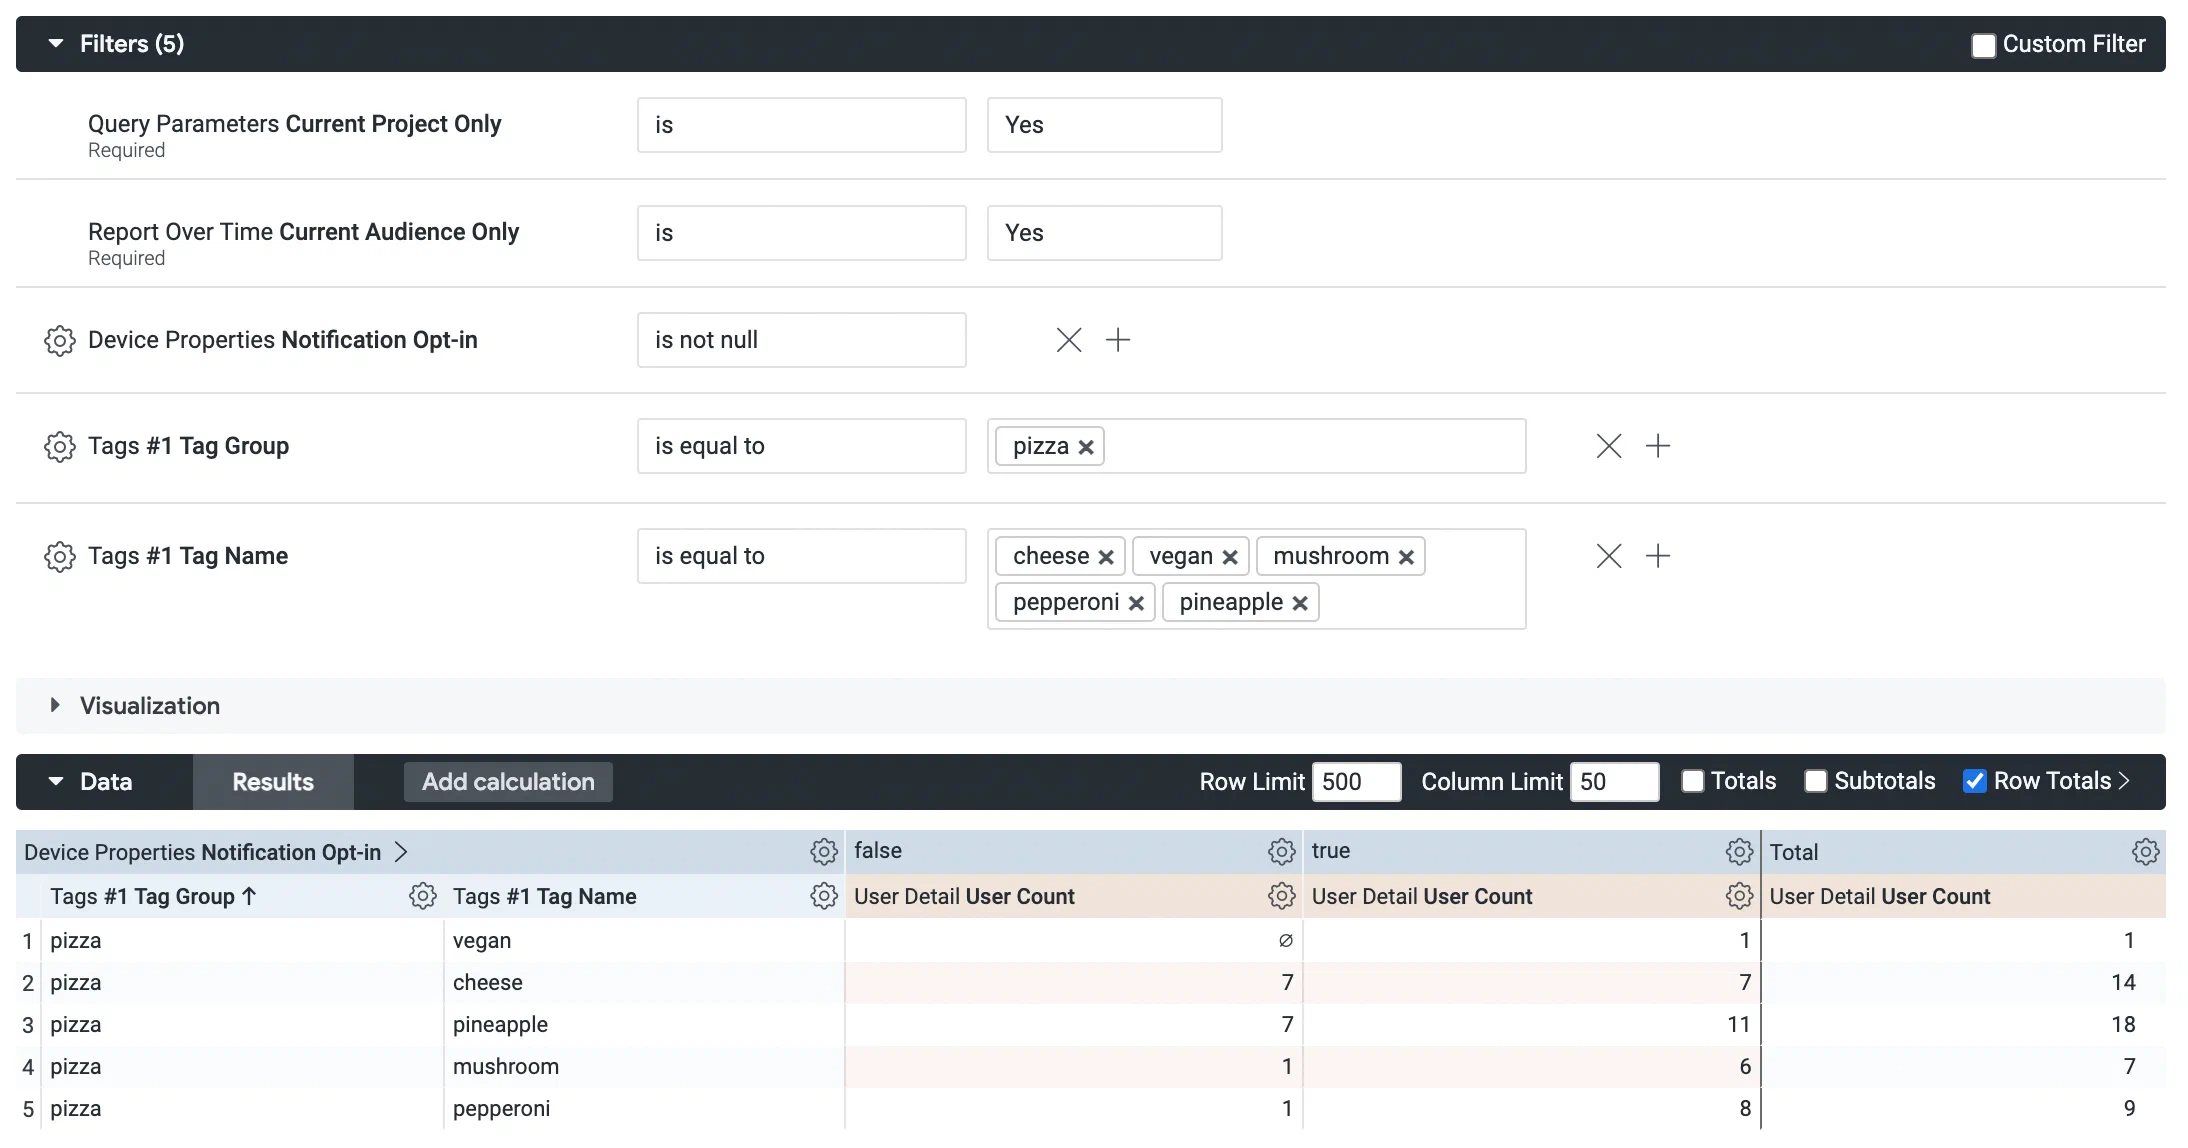 *Creating a custom query from the Audience with Attributes Explore* # Custom queries and reference for the Custom Events Explore > Use the Custom Events Explore to query Custom Event metrics, list users by event, and find peak engagement times. This Explore allows you to get detailed metrics for your [Custom Events](https://www.airship.com/docs/reference/glossary/#custom_event).Data availability depends on your Performance Analytics plan.
## Navigation To access the Explore: 1. Go to **Reports**, then **Performance Analytics**. 1. Select the folder icon (folder-simple), then **Shared**. 1. Under **Looks**, select **Explore Glossary** (**Explore Glossary EUCS** for EU customers). 1. Select **Custom Events**, then **Navigate to Explore**.For a list of all Explores in the glossary, see Predefined Explores in Exploring Performance Analytics data.
## Field categoriesThe sidebar lists categories for various filters, [Dimensions](https://www.airship.com/docs/reference/glossary/#pa_dimension), and [Measures](https://www.airship.com/docs/reference/glossary/#pa_measure) you can use to explore your data. To see their definitions, hover over an item, then select the info icon (ⓘ).
Field categories in the Custom Events Explore: | Category | Description | | --- | --- | | **Attributes Current** | Get Attribute values associated with the channels at the time the report is run. | | **Attributes Relative** | Get Attribute values associated with the channels at the time the filtered Custom Event occurred. | | **Custom Event Properties** | Set Custom Event property parameters for the query. | | **Custom Events** | Set Custom Event parameters for the query. | | **Device Properties Current** | Get device property values associated with the channels at the time the report is run. | | **Device Properties Relative** | Get device property values associated with the channels at the time the filtered Custom Event occurred. | | **In-App Automation** | Get configuration details about [In-App Automations](https://www.airship.com/docs/reference/glossary/#iaa), such as priority, dates, and display type (layout/format). | | **Message Content** | Get the Message text and additional details, such as notification ID and title, about the message to which the Custom Event is attributed. | | **Query Parameters** | Target all or specific projects, and specify dates and response windows, where relevant. | | **Tags Current** | Get Tag values associated with the channels at the time the report is run. | | **Tags Relative** | Get Tag values associated with the channels at the time the filtered Custom Event occurred. | | **User Detail** | Get information about the channel that performed the filtered event. | | **User Detail - Derived** | Get historical information about the channel that performed the filtered event. | {class="table-col-1-20"} ### Default filtersUse filters to reduce the number of records scanned and results returned. Each Explore includes filters that cannot be removed from the query.
The filter name, [field category](#field-categories), and usage information for the default filters in the Custom Events Explore: | Filter name | Field category | Use the filter to... | |-------------|----------------|----------------------| | **Current Project Only** | Query Parameters | Determine which projects are included in the query. Default: **Yes**. To include other projects, 1) select **No**, 2) in the sidebar, select **Query Parameters**, 3) under **Dimensions**, select the filter icon (funnel-simple) next to **Project name**, and 4) in the Filters section, choose which projects to include. | | **Date Range** | Query Parameters | Target events that occurred on a specific date or within a specific date range. | {class="table-col-1-20 table-col-2-20"} ## Building custom queries The following sections walk you through using the Custom Events Explore to create custom queries that answer: * How do I get a list of channels that performed a specific event over the past seven days? * How do I determine what time of day users most frequently perform a specific event? ### Get a list of channels Follow these steps to get a list of channels that performed a specific Custom Event over the past seven days. First, [open the Custom Events explore](#navigation), and then configure your query: 1. Set up the filters: 1. Leave **Current Project Only** set to `is Yes`. 1. Leave **Date Range** set to `is in the last 7 complete days`. 1. Select **+ Add Filter** and select **Custom Events**, then **Custom Event Name**, and enter your event name, for example, `item_purchase`. Only events that occurred within the past 90 days are available. 1. In the sidebar, specify the values and measures to display: 1. Select **User Detail**, then select the Dimension **Channel ID**. 1. Select **Custom Events**, then select the Measure **Event Count**.Now you are ready to get your data. Select Run, and you should see results similar to the below image. To save your custom query for later access, follow the steps in Saving Performance Analytics queries.
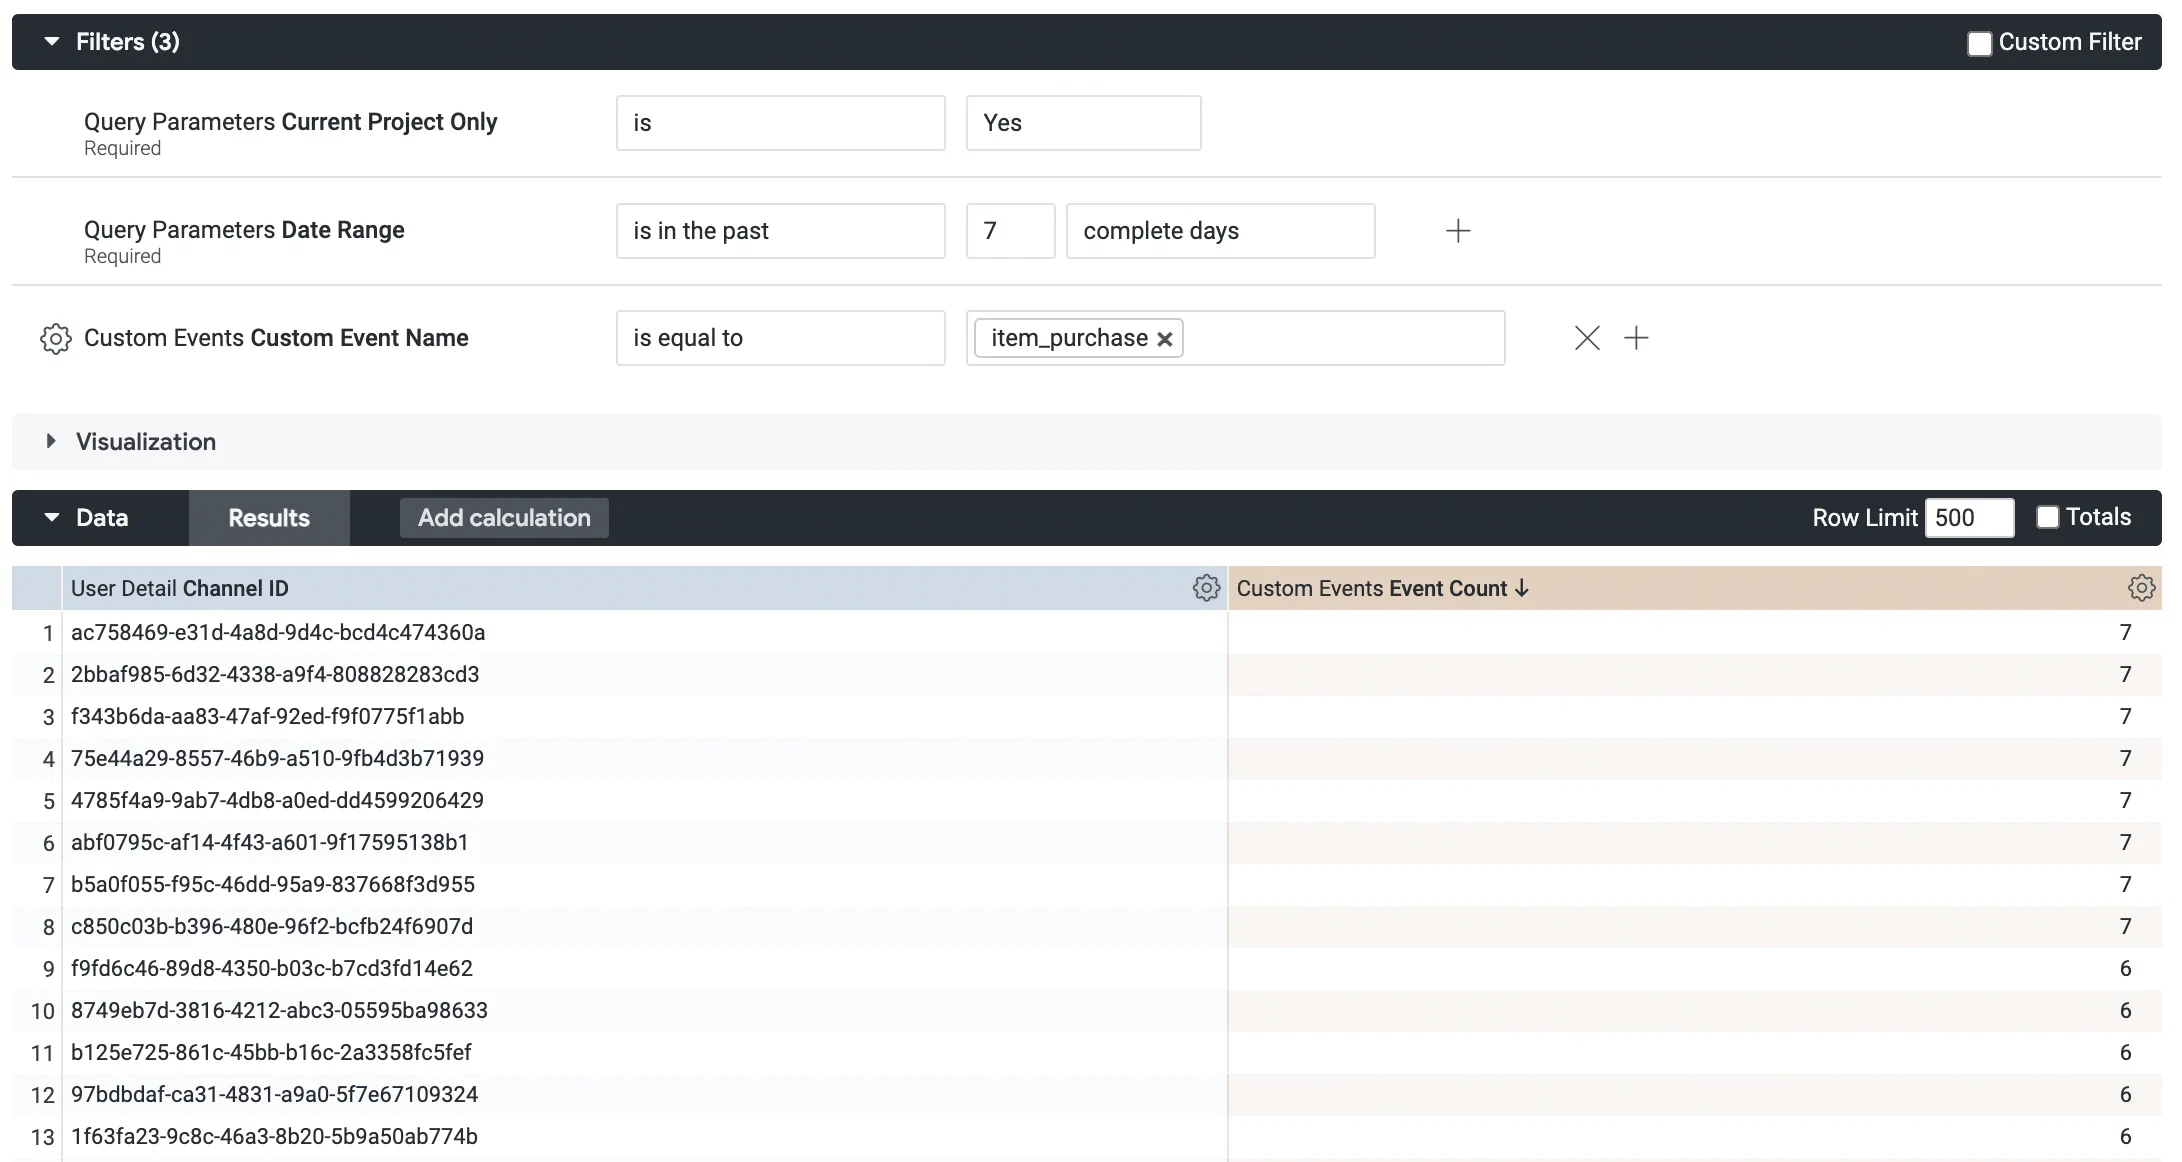 *Creating a custom query from the Custom Events Explore* ### Find peak engagement times Follow these steps to identify the times of day when a Custom Event is most frequently performed. This information can help determine the most relevant time of day to send your campaigns. First, [open the Custom Events explore](#navigation), and then configure your query: 1. Set up the filters: 1. Leave **Current Project Only** set to `is Yes`. 1. Set **Date Range** to `is in the last 90 complete days`. 1. Select **+ Add Filter** and select **Custom Events**, then **Custom Event Name**, and enter your event name, for example, `order_completed`. Only events that occurred within the past 90 days are available. 1. In the sidebar, specify the values and measures to display: 1. Select **Custom Events**, then select **Custom Event Date** and choose **Hour of Day**. 1. Select **Custom Events**, then select the Measure **Event Count**. Now you are ready to get your data. Select **Run**, and you should see results similar to the image below. 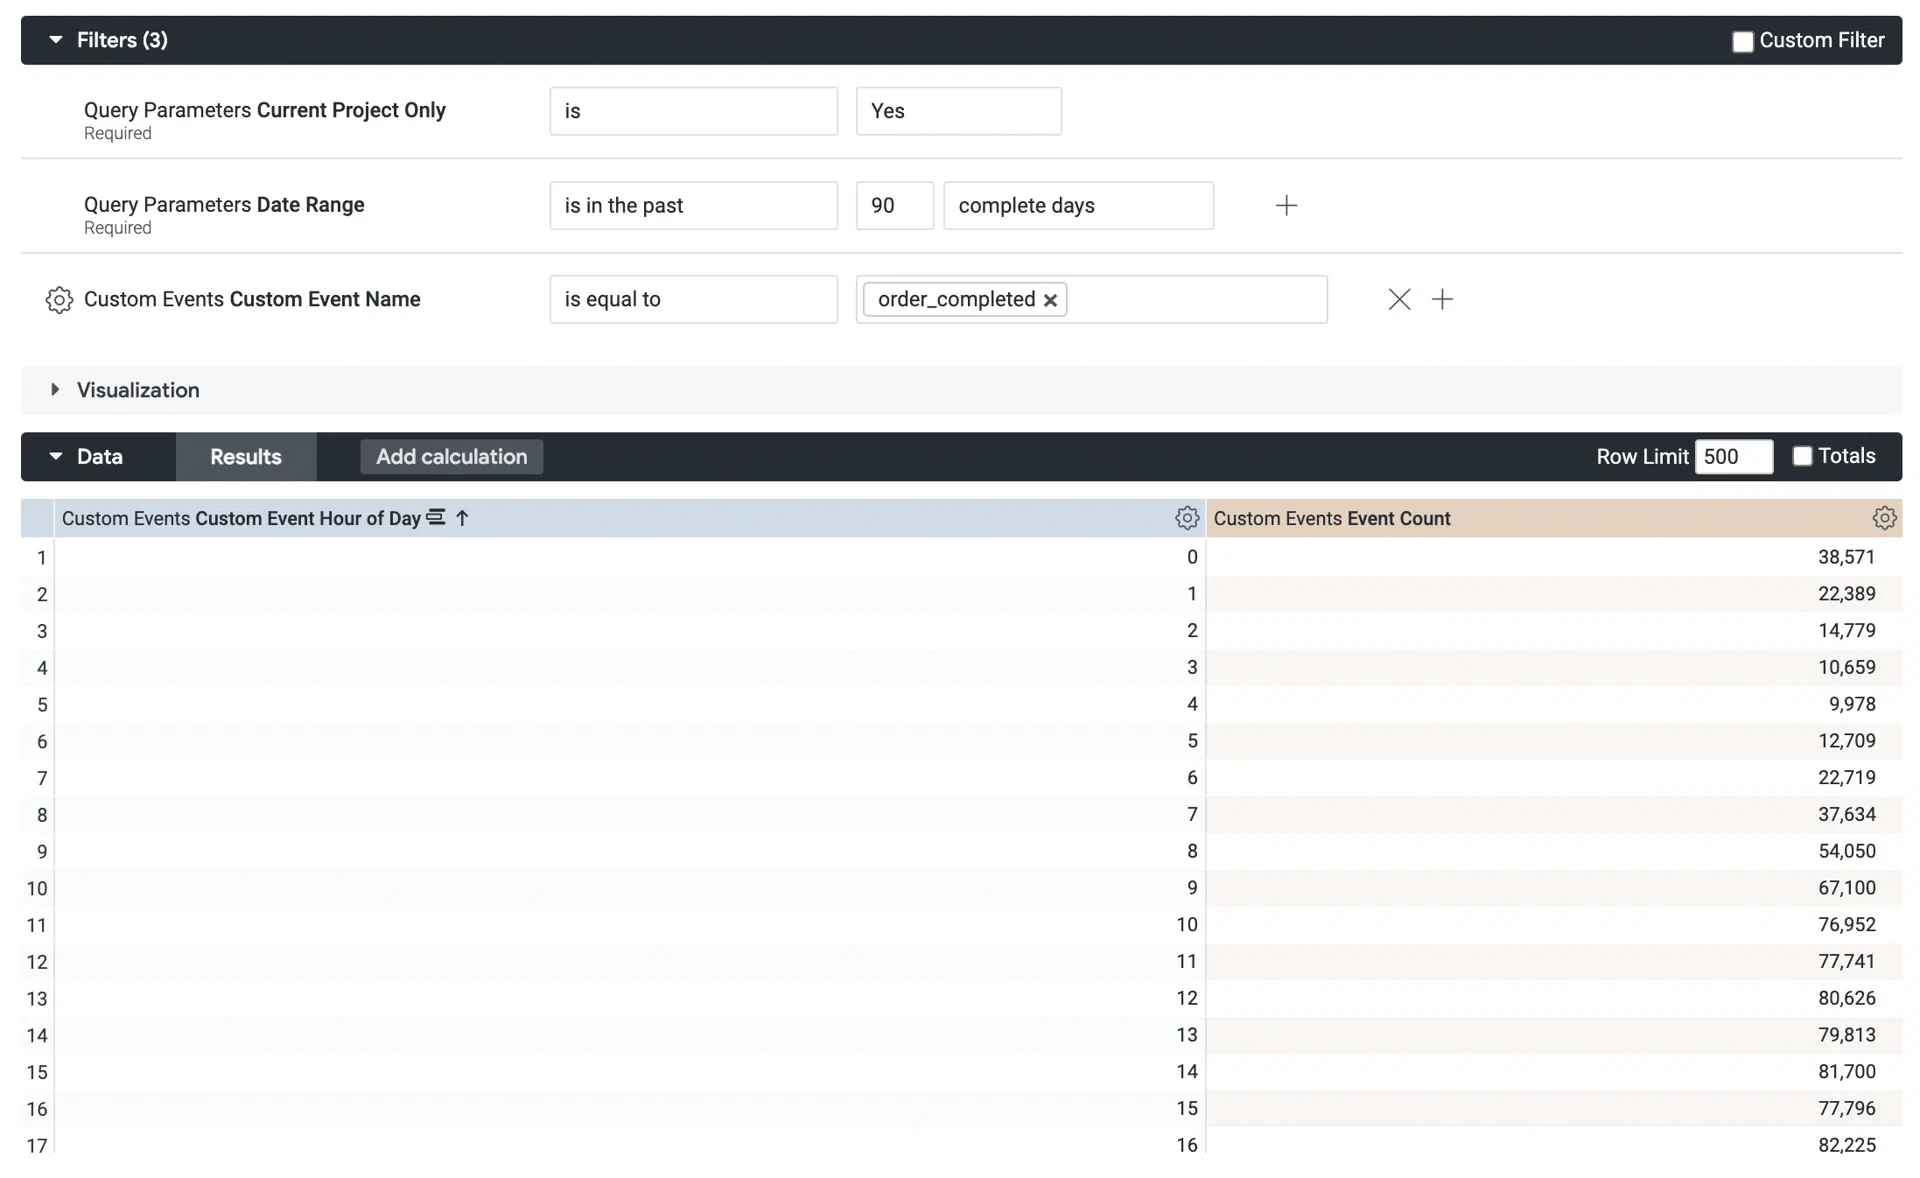 *Creating a custom query from the Custom Events Explore* Next, select the down arrow icon (▼) next to **Visualization** and select the column icon ( ). Use this format to identify the times of day when users are most engaged. You can also add a reference line to make your report clearer. In the Visualization bar, select **Edit**, then **Y**, then **Add Reference Line**. 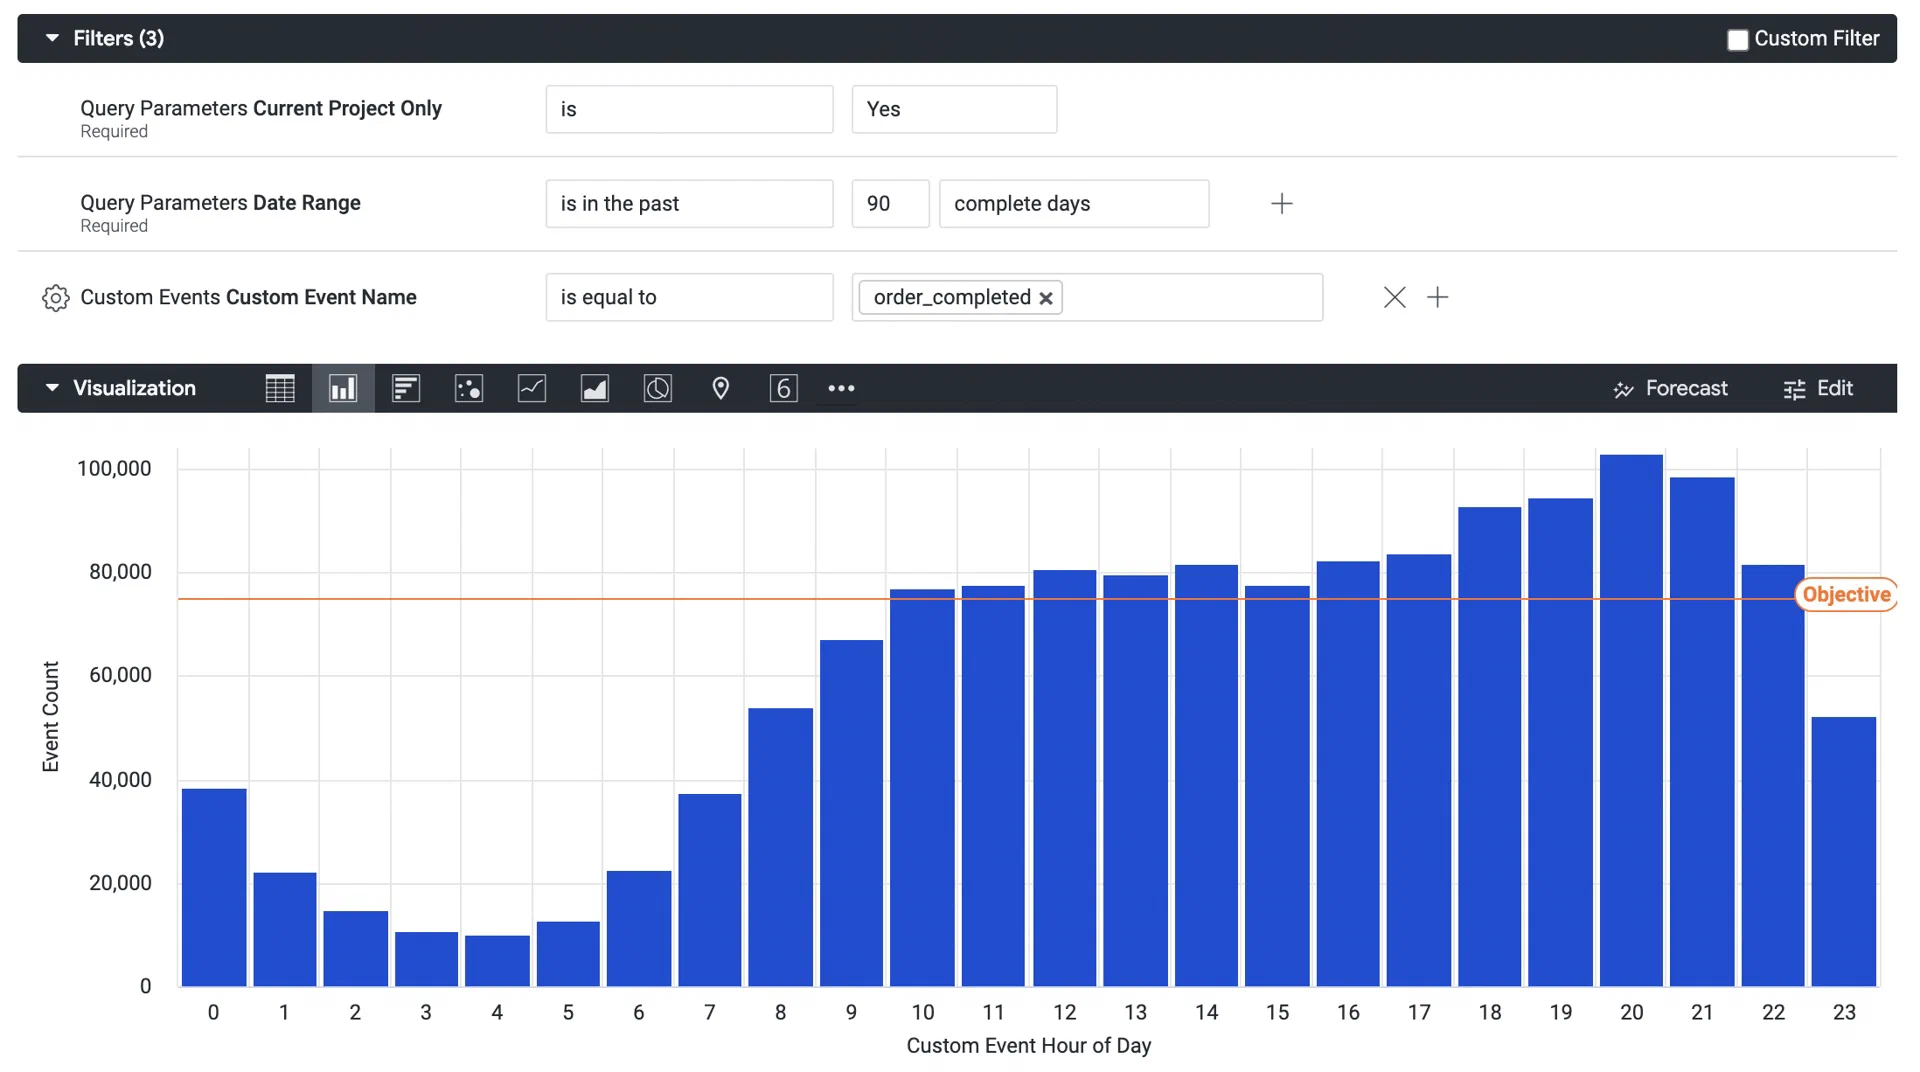 *The column visualization of a custom query from the Custom Events Explore* To save your custom query for later access, follow the steps in [Saving Performance Analytics queries](https://www.airship.com/docs/guides/reports/analytics/tasks-queries/saving-queries/). # Custom queries and reference for the Device Events Explore > Use the Device Events Explore to get data related to device activity. You can get detailed metrics for these default events: App Session, Install, Uninstall, Web Session, SMS First Opt-In, and Email First Opt-In.Data availability depends on your Performance Analytics plan.
## Navigation To access the Explore: 1. Go to **Reports**, then **Performance Analytics**. 1. Select the folder icon (folder-simple), then **Shared**. 1. Under **Looks**, select **Explore Glossary** (**Explore Glossary EUCS** for EU customers). 1. Select **Device Events**, then **Navigate to Explore**.For a list of all Explores in the glossary, see Predefined Explores in Exploring Performance Analytics data.
## Field categoriesThe sidebar lists categories for various filters, [Dimensions](https://www.airship.com/docs/reference/glossary/#pa_dimension), and [Measures](https://www.airship.com/docs/reference/glossary/#pa_measure) you can use to explore your data. To see their definitions, hover over an item, then select the info icon (ⓘ).
Field categories in the Device Events Explore: | Category | Description | | --- | --- | | **Attributes Current** | Get Attribute values associated with the channels at the time the report is run. | | **Attributes Relative** | Get Attribute values associated with the channels at the time filtered event occurred. | | **Device Events** | Set device event parameters for the query. | | **Device Properties Current** | Get device property values associated with the channels at the time the report is run. | | **Device Properties Relative** | Get device property values associated with the channels at the time filtered event occurred. | | **Query Parameters** | Target all or specific projects, and specify dates and response windows, where relevant. | | **Tags Current** | Get Tag values associated with the channels at the time the report is run. | | **Tags Relative** | Get Tag values associated with the channels at the time filtered event occurred. | | **User Detail** | Get information about the channel that performed the filtered event. | | **User Detail - Derived** | Get historical information about the channel that performed the filtered event. | {class="table-col-1-20"} ### Default filtersUse filters to reduce the number of records scanned and results returned. Each Explore includes filters that cannot be removed from the query.
The filter name, [field category](#field-categories), and usage information for the default filters in the Device Events Explore: | Filter name | Field category | Use the filter to... | |-------------|----------------|----------------------| | **Current Project Only** | Query Parameters | Determine which projects are included in the query. Default: **Yes**. To include other projects, 1) select **No**, 2) in the sidebar, select **Query Parameters**, 3) under **Dimensions**, select the filter icon (funnel-simple) next to **Project name**, and 4) in the Filters section, choose which projects to include. | | **Date Range** | Query Parameters | Target events that occurred on a specific date or within a specific date range. | | **Event Type Filter** | Device Events | Return results for a specific event type. Default: **App Session**. Other options: **Install**, **Uninstall**, **Web Session**, **SMS First Opt-In**, **Email First Opt-In**, or **All**. | {class="table-col-1-20 table-col-2-20"} ## Building custom queries The following sections walk you through using the Device Events Explore to create custom queries that answer: * How can I get install and uninstall counts? * How can I determine the hour of the day when my users are the most active? ### Get install and uninstall counts Follow these steps to get the number of install and uninstall events over the past 30 days. First, [open the Device Events explore](#navigation), and then configure your query: 1. Set up the filters: 1. Set **Event Type Filter** to `is All`. 1. Leave **Current Project Only** set to `is Yes`. 1. Set **Date Range** to `is in the last 30 complete days`. 1. In the sidebar, specify values and measures to display: 1. Select **Device Events**, then the Dimension **Event Date**, then **Date**. 1. Also in **Device Events**, select the Measures **Install Count** and **Uninstall Count**. 1. Select the **Line** visualization format to display the report as a line graph.Now you are ready to get your data. Select Run, and you should see results similar to the below image. To save your custom query for later access, follow the steps in Saving Performance Analytics queries.
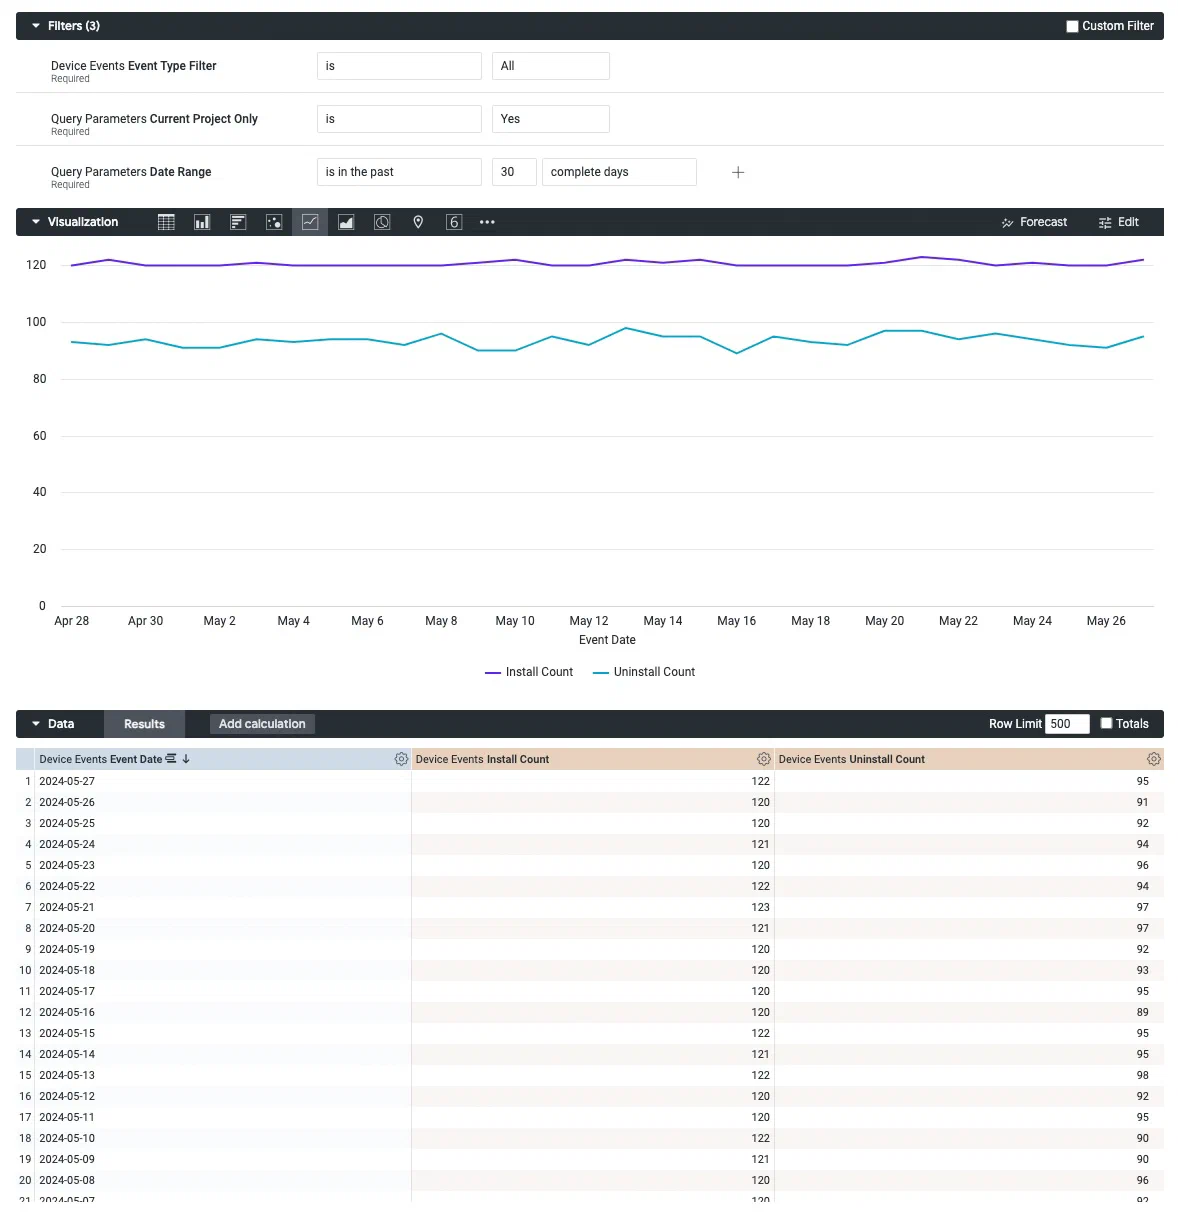 *Creating a custom query from the Device Events Explore* ### Find the most active hour Follow these steps to determine the hour of the day when your users are the most active. First, [open the Device Events explore](#navigation), and then configure your query: 1. Set up the filters: 1. Leave **Event Type Filter** set to `is App Session`. 1. Leave **Current Project Only** set to `is Yes`. 1. Set **Date Range** to `is in the last 30 complete days`. 1. In the sidebar, specify values and measures to display: 1. Select **Device Events**, then the Dimension **Event Date**, then **Hour of Day**. 1. Also in **Device Events**, select the Measure **App Session Count**. 1. Select the **Column** visualization format to display the report as a column chart / bar graph.Now you are ready to get your data. Select Run, and you should see results similar to the below image. To save your custom query for later access, follow the steps in Saving Performance Analytics queries.
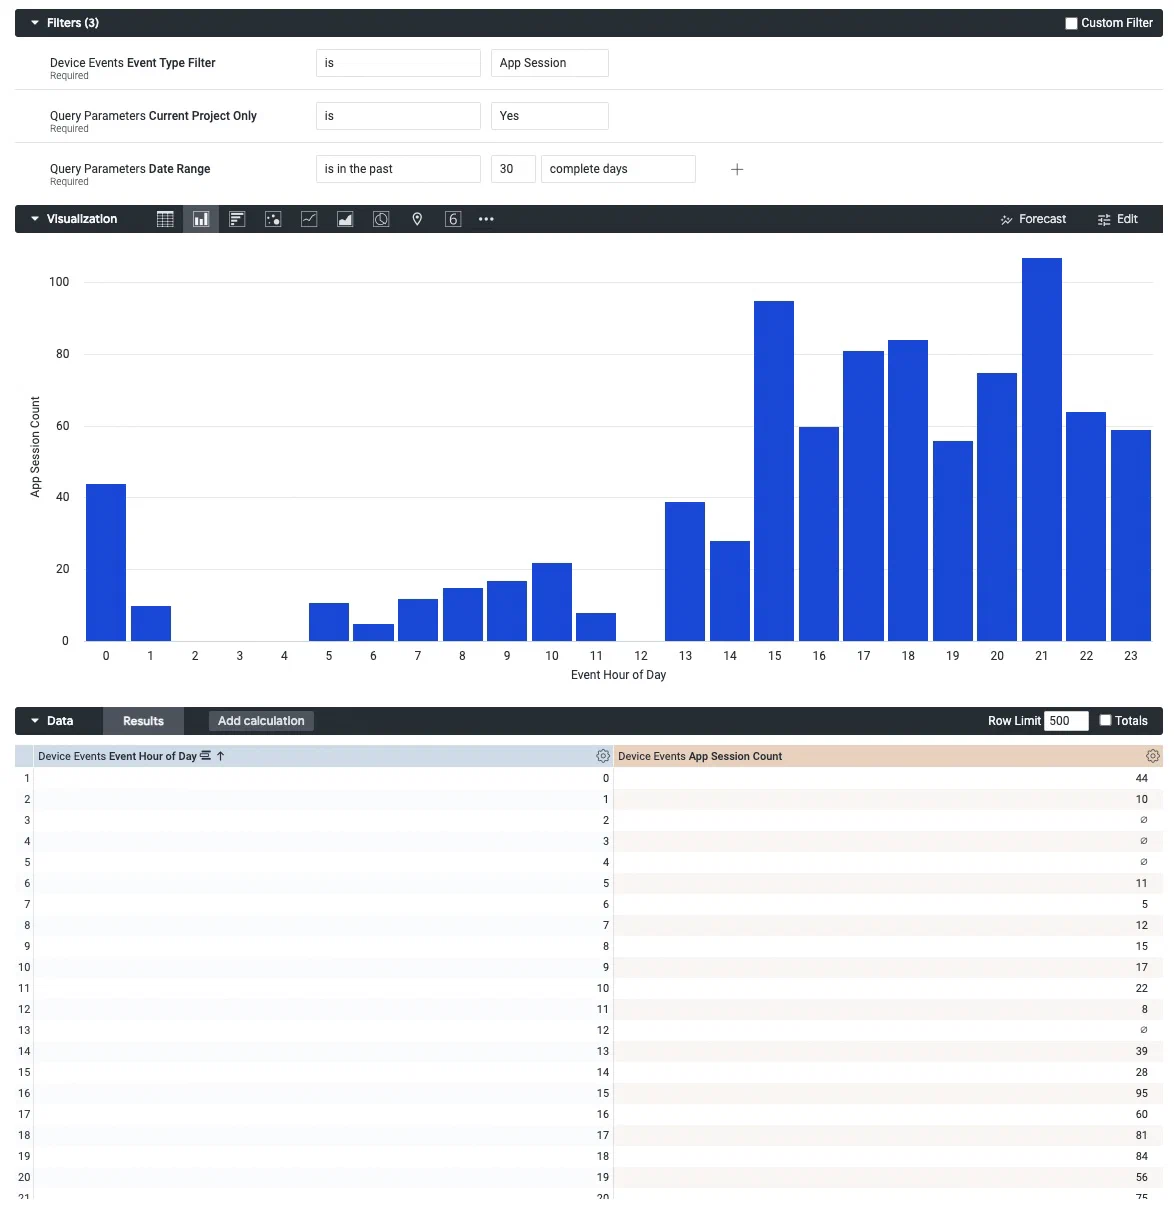 *Creating a custom query from the Device Events Explore* # Custom queries and reference for the Engagement Explore > Use the Engagement Explore to analyze the performance of your campaigns. You can get metrics and other information about all the events associated with a message, like [Tag](https://www.airship.com/docs/reference/glossary/#tag) and [Attribute](https://www.airship.com/docs/reference/glossary/#attributes) changes and [Custom Events](https://www.airship.com/docs/reference/glossary/#custom_event). Data returned is at the user level.Data availability depends on your Performance Analytics plan.
## Navigation To access to the Explore: 1. Go to **Reports**, then **Performance Analytics**. 1. Select the folder icon (folder-simple), then **Shared**. 1. Under **Looks**, select **Explore Glossary** (**Explore Glossary EUCS** for EU customers). 1. Select **Engagement**, then **Navigate to Explore**.For a list of all Explores in the glossary, see Predefined Explores in Exploring Performance Analytics data.
## Field categoriesThe sidebar lists categories for various filters, [Dimensions](https://www.airship.com/docs/reference/glossary/#pa_dimension), and [Measures](https://www.airship.com/docs/reference/glossary/#pa_measure) you can use to explore your data. To see their definitions, hover over an item, then select the info icon (ⓘ).
Field categories in the Engagement Explore: | Category | Description | | --- | --- | | **A/B Testing** | Get data about [Message A/B tests](https://www.airship.com/docs/guides/experimentation/a-b-tests/messages/). Include the Dimension **A/B Test ID** to query a specific experiment. For [legacy message A/B tests](https://www.airship.com/docs/guides/experimentation/a-b-tests/messages-legacy/), use the Dimensions **Variant Message (Legacy)** and **Variant ID (Legacy)**. | | **Attributes Current** | Get Attribute values associated with the channels at the time the report is run. | | **Attributes Relative** | Get Attribute values associated with the channels at the time push notification or Message Center message was sent or when the in-app message was displayed. | | **Device Properties Current** | Get device property values associated with the channels at the time the report is run. | | **Device Properties Relative** | Get device property values associated with the channels at the time push notification or Message Center message was sent or when the in-app message was displayed. | | **In-App Automation** | Get configuration details about In-App Automations and Scenes, such as priority, dates, and display type (layout/format). | | **Message Content** | Get the message text and additional details, such as notification ID, title, etc. In the Dimension and Measure names, Journey means [Sequence](https://www.airship.com/docs/reference/glossary/#sequence). | | **Message Delivery** | Get data about sends, such as dates, rates, and counts. SMS includes the Dimension **SMS Deliveries — Is RCS (Yes / No)** and the Measure **RCS Read Count**. | | **Message Metrics** | Get performance data, such as response and click rates, including bounce data for email. | | **Query Parameters** | Target all or specific projects, and specify dates and response windows, where relevant. | | **Response - Custom Events** | Get metrics for Custom Events associated with [App direct and indirect opens](https://www.airship.com/docs/guides/audience/events/custom-events/#push-attribution). | | **Response - Custom Event Window** | Get metrics for Custom Events associated with [App direct and indirect opens](https://www.airship.com/docs/guides/audience/events/custom-events/#push-attribution) that occurred within one hour of send time. To set a new time window, go to **Query Parameters** in the sidebar, then select the **Response Window** filter and configure the filter. Fractions of an hour are accepted. | | **Response - Custom Event Window - Time-only** | Get metrics for Custom Events, regardless of attribution, that occurred within one hour of send time. To set a new time window, go to **Query Parameters** in the sidebar, then select the **Response Window** filter and configure the filter. Fractions of an hour are accepted. | | **Response - Custom Interaction Events** | Get metrics for Custom Events associated with an [`interaction_id`](https://www.airship.com/docs/developer/rest-api/ua/schemas/others/#customeventobject). | | **Response - Events Times** | Get metrics for [App direct and indirect opens](https://www.airship.com/docs/guides/audience/events/custom-events/#push-attribution) that occurred within a specific number of minutes after send time. To set a new time window, go to **Query Parameters** in the sidebar, then select the **Response Window** filter and configure the filter. Fractions of an hour are accepted. | | **Response - Tag Changes** | Get Tag change events that occurred within one hour of send time. To set a new time window, go to **Query Parameters** in the sidebar, then select the **Response Window** filter and configure the filter. Fractions of an hour are accepted. | | **Tags Current** | Get Tag values associated with the channels at the time the report is run. | | **Tags Relative** | Get Tag values associated with the channels at the time push notification or Message Center message was sent or when the in-app message was displayed. | | **Timeframe Comparison** | Compare data in Measures for the most recent and prior time frames. Specify time frames in a number of days. | | **User Detail** | Get information about the channel that performed the filtered event. | | **User Detail - Derived** | Get historical information about the channel that performed the filtered event. | {class="table-col-1-20"} ### Default filtersUse filters to reduce the number of records scanned and results returned. Each Explore includes filters that cannot be removed from the query.
The filter name, [field category](#field-categories), and usage information for the default filters in the Engagement Explore: | Filter name | Field category | Use the filter to... | |-------------|----------------|----------------------| | **Message Type Filter** | Message Delivery | Return results for a specific message type. Default: **Push Notification**. Options: **Message Center**, **In-App Impression**1, **Web Notification**, **SMS notification**, **Email Notification**, or **Multiple**. By default, **Multiple** returns all message types, which can result in longer processing time. To limit types, select **Multiple**, then 1) in the sidebar, select **Message Delivery**, 2) under **FILTER-ONLY FIELDS**, select **Message Type Sub Filter**, 3) in the Filters section, choose which message types to include. | | **Current Project Only** | Query Parameters | Determine which projects are included in the query. Default: **Yes**. To include other projects, 1) select **No**, 2) in the sidebar, select **Query Parameters**, 3) under **Dimensions**, select the filter icon (funnel-simple) next to **Project name**, and 4) in the Filters section, choose which projects to include. | | **Date Range** | Query Parameters | Target events that occurred on a specific date or within a specific date range. | {class="table-col-1-20 table-col-2-20"} 1. Includes [In-App Message (standard)](https://www.airship.com/docs/reference/glossary/#in_app_message) and [In-App Automation](https://www.airship.com/docs/reference/glossary/#iaa) only. ## Building custom queries The following sections walk you through using the Engagement Explore to create custom queries that answer: * How can I get the list of users who received a specific In-App Automation? Also, how can I determine whether they interacted with it? * How can I get complete metrics for the push notifications sent within the past 30 days? ### In-App Automation Follow these steps to get the list of users who received a specific [In-App Automation](https://www.airship.com/docs/reference/glossary/#iaa) and determine whether they interacted with it. Users will be identified by [Channel ID](https://www.airship.com/docs/reference/glossary/#channel_id). First, get the ID of the In-App Automation you want to build a query for. From your Airship project: 1. Go to **Messages**, then **Messages Overview**. 1. Find your In-App Automation and select the report icon ( ) to open its message report. 1. In the page URL, copy the section following `push detail/`. It should look similar to: `e68039fc-7c9d-4a49-8a83-d6c8efa0cde6`. Then [open the Engagement explore](#navigation) and configure your query: 1. Set up the filters: 1. Set **Message Type Filter** to `is In-App Impression`. 1. Leave **Current Audience Only** set to `is Yes`. 1. Set **Date Range** to the period of time you want to search in. 1. In the sidebar, select **Message Content**, then **Notification ID Filter**. > **Tip:** Instead of navigating to filters, Dimensions, and Measures, you can find them using the search box at the top of the sidebar. 1. Set **Notification ID Filter** to `is equal to` and enter the notification ID you copied from the message report URL. 1. In the sidebar, specify values to display: 1. Select **Message Content**, then select the Dimensions **Notification ID** and **Notification Name**. 1. Select **Message Delivery**, then select the Dimensions category **Delivery Date**, then **Date**. 1. Select **User Detail**, then select the Dimension **Channel ID**. If you're using [Named Users](https://www.airship.com/docs/reference/glossary/#named_user) in your project, you can also add the Dimension **Named User** to identify these users in your database. 1. In the sidebar, add measurements to display: 1. Select **Message Delivery**, then select the Measures category **All Deliveries/Impressions**, then **Total Delivery/Impression Count**. 1. Select **Message Metrics**, then select the Measures category **In-App Impressions**, then **In-App Button Click Count** and **In-App Dismissed Count**. These distinguish which users interacted with the a button in the message content from the users who selected the Dismiss button to close the message.Now you are ready to get your data. Select Run, and you should see results similar to the below image. To save your custom query for later access, follow the steps in Saving Performance Analytics queries.
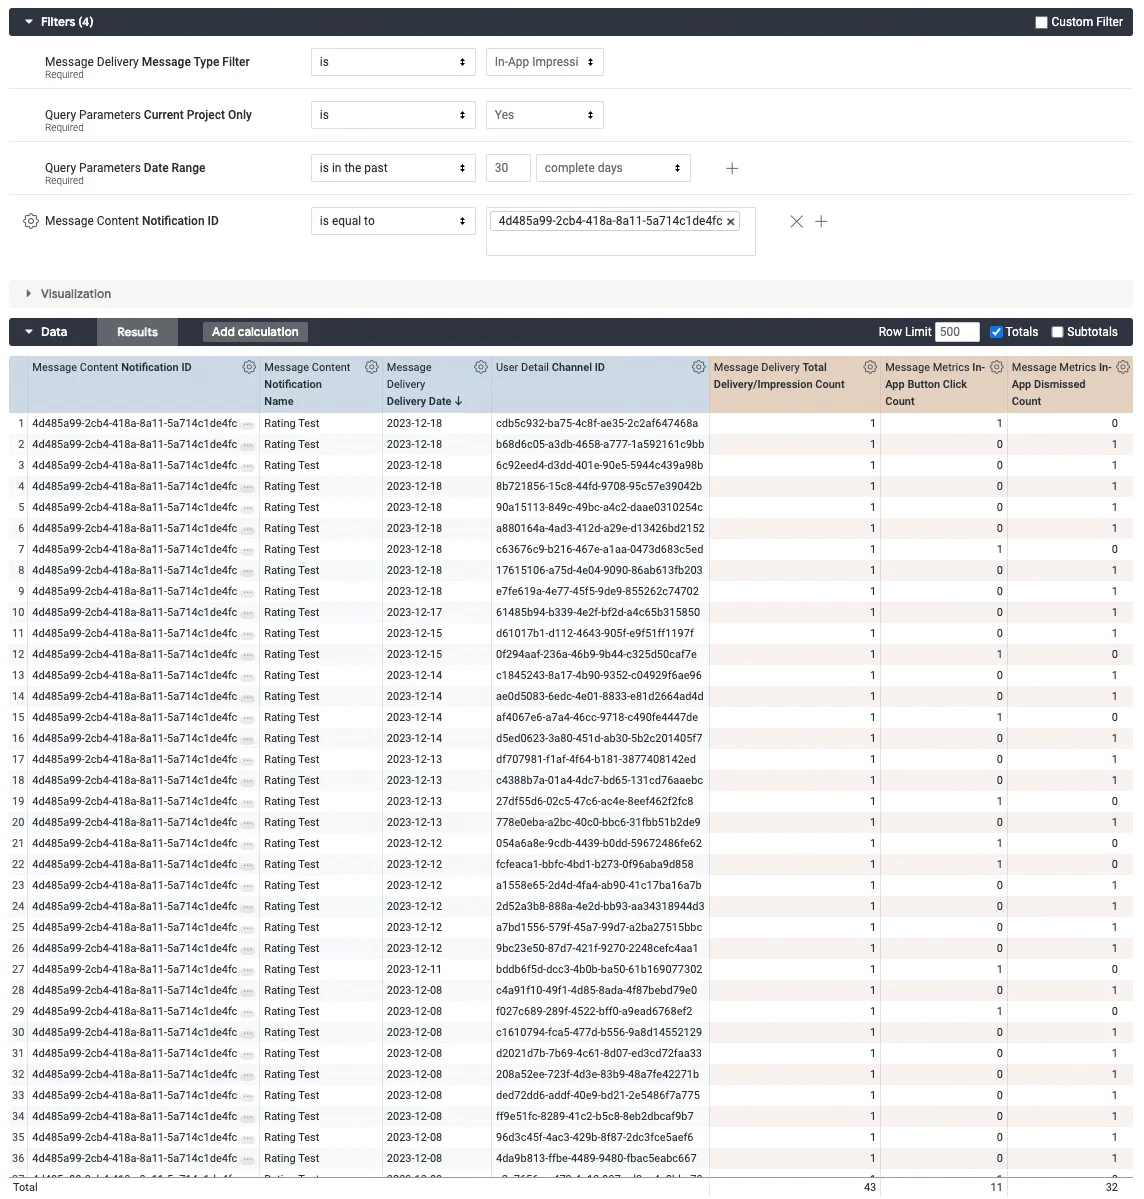 *Creating a custom query from the Engagement Explore* ### Push notifications Follow these steps to get the number of push notifications delivered over the past 30 days. We'll use the default filters and add a filter for platform to get only data for iOS and Android. First, [open the Engagement explore](#navigation), and then configure your query: 1. Set up the filters: 1. Leave **Message Type Filter** and **Current Project Only** set to their defaults `is Push Notification` and `is Yes`. 1. Set **Date Range** to `is in the last 30 complete days`. 1. In the sidebar, select **User Detail**, then **Platform Filter**. > **Tip:** Instead of navigating to filters, Dimensions, and Measures, you can find them using the search box at the top of the sidebar. 1. Leave **Platform Filter** set to `is equal to`, and then select the entry field and select `ANDROID` and `IOS` from the list. 1.  *Selecting the option to pivot data* In the sidebar, specify values to display: 1. Select **Message Delivery**, then select the Dimensions category **Delivery Date**, then **Date**. 1. Select **User Detail**, select the Dimension **Platform**, then select the double-arrow icon next to **Platform**. The pivot option adds detailed metrics for each platform and makes it more readable. It can be helpful when using the Graph visualization. 1. In the sidebar, add measurements to display: 1. Select **Message Delivery**, then select the Measures category **All Deliveries/Impressions**, then **Total Delivery/Impression Count**. 1. Select **Message Metrics**, then select the Measures category **Push Metrics**, then **Attributed Open Count**. Now you are ready to get your data. Select **Run**, and you should see results similar to the image below. 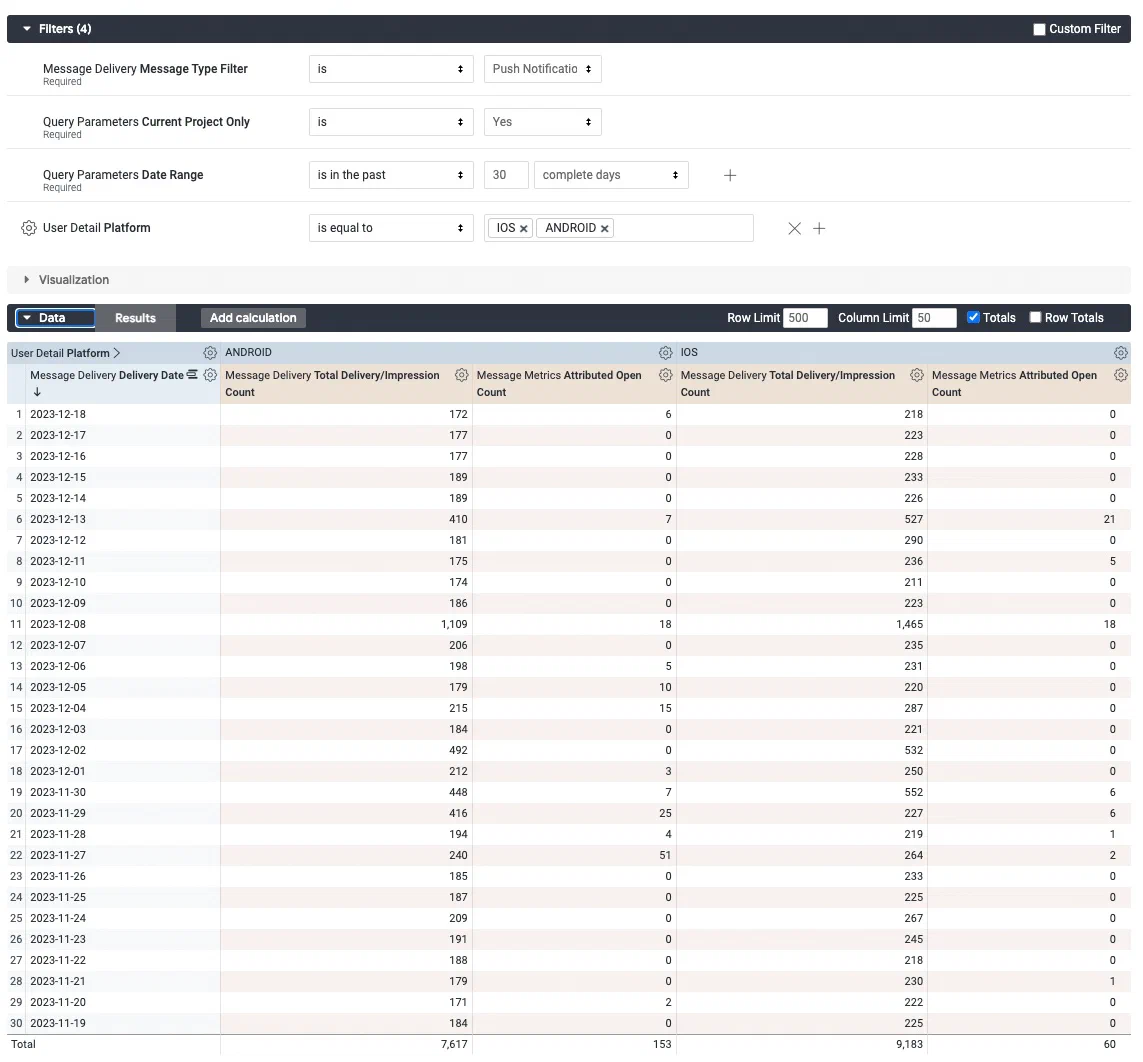 *Creating a custom query from the Engagement Explore* Next, select the down arrow icon (▼) next to **Visualization** and select the column icon ( ). Use this format to look for obvious gaps or other changes to help you identify if something is going wrong with your push delivery: 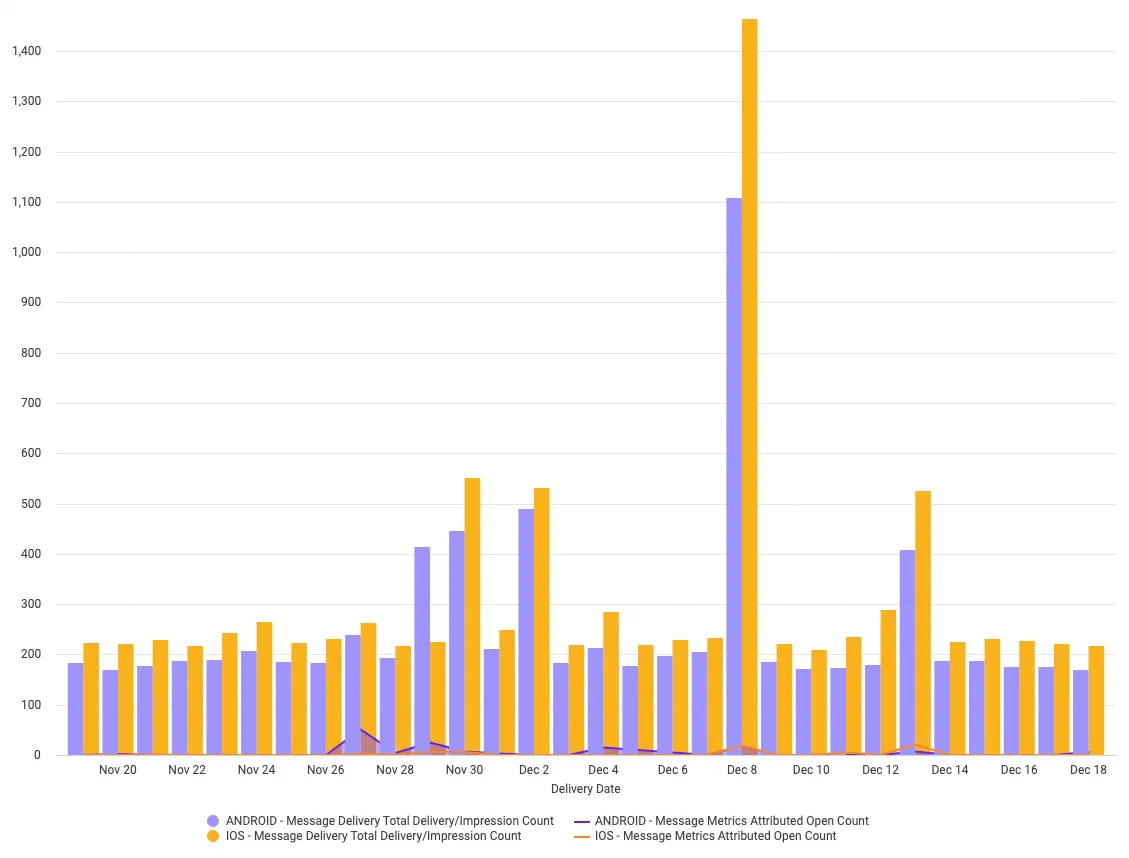 *The column visualization of a custom query from the Engagement Explore* To save your custom query for later access, follow the steps in [Saving Performance Analytics queries](https://www.airship.com/docs/guides/reports/analytics/tasks-queries/saving-queries/). # Custom queries and reference for the Scenes Explore > Use the Scenes Explore to analyze the performance of your Scenes and the relevance of each screen. Access history related to [Scene](https://www.airship.com/docs/reference/glossary/#scene)Data availability depends on your Performance Analytics plan.
## Navigation To access the Explore: 1. Go to **Reports**, then **Performance Analytics**. 1. Select the folder icon (folder-simple), then **Shared**. 1. Under **Looks**, select **Explore Glossary** (**Explore Glossary EUCS** for EU customers). 1. Select **Scenes**, then **Navigate to Explore**.For a list of all Explores in the glossary, see Predefined Explores in Exploring Performance Analytics data.
## Field categoriesThe sidebar lists categories for various filters, [Dimensions](https://www.airship.com/docs/reference/glossary/#pa_dimension), and [Measures](https://www.airship.com/docs/reference/glossary/#pa_measure) you can use to explore your data. To see their definitions, hover over an item, then select the info icon (ⓘ).
Field categories in the Scenes Explore: | Category | Description | | --- | --- | | **Attributes Current** | Get Attribute values associated with the channels at the time the report is run. | | **Attributes Relevant** | Get Attribute values associated with the channels at the time the Scene was displayed. | | **Device Properties Current** | Get device property values associated with the channels at the time the report is run. | | **Device Properties Relative** | Get device property values associated with the channels at the time the Scene was displayed. | | **Query Parameters** | Target all or specific projects, and specify dates and response windows, where relevant. | | **Scenes** | Set Scene parameters for the query. Includes survey-related data if NPS or Questions are included in a Scene. | | **Survey** | Set Survey parameters for the query. Does not include data from Scenes. | | **Tags Current** | Get Tag values associated with the channels at the time the report is run. | | **Tags Relative** | Get Tag values associated with the channels at the time the Scene was displayed. | | **User Detail** | Get information about the channel that performed the filtered event. | {class="table-col-1-20"} ### Default filtersUse filters to reduce the number of records scanned and results returned. Each Explore includes filters that cannot be removed from the query.
The filter name, [field category](#field-categories), and usage information for the default filters in the Scenes Explore: | Filter name | Field category | Use the filter to... | |-------------|----------------|----------------------| | **Current Project Only** | Query Parameters | Determine which projects are included in the query. Default: **Yes**. To include other projects, 1) select **No**, 2) in the sidebar, select **Query Parameters**, 3) under **Dimensions**, select the filter icon (funnel-simple) next to **Project name**, and 4) in the Filters section, choose which projects to include. | | **Date Range** | Query Parameters | Target events that occurred on a specific date or within a specific date range. | {class="table-col-1-20 table-col-2-20"} ## Building custom queries The following sections walk you through using the Scenes Explore to create custom queries that answer: * How can I identify the users who completed a Scene? * To optimize my Scene, how do I determine which screen is the most relevant and which one generates churn? ### Identify who completed a Scene Follow these steps to get the [Channel IDs](https://www.airship.com/docs/reference/glossary/#channel_id) of the users who viewed all screens in a specific Scene and the number of times they viewed it. First, get the [Push ID](https://www.airship.com/docs/reference/glossary/#push_id) for the Scene you want information about:pushdetail/ in the URL. In this image, the ID is 644dae8d-4ff4-4688-9fe9-e7dac2138ea7:

*Copying the Push ID from the message report URL*Now you are ready to get your data. Select Run, and you should see results similar to the below image. To save your custom query for later access, follow the steps in Saving Performance Analytics queries.
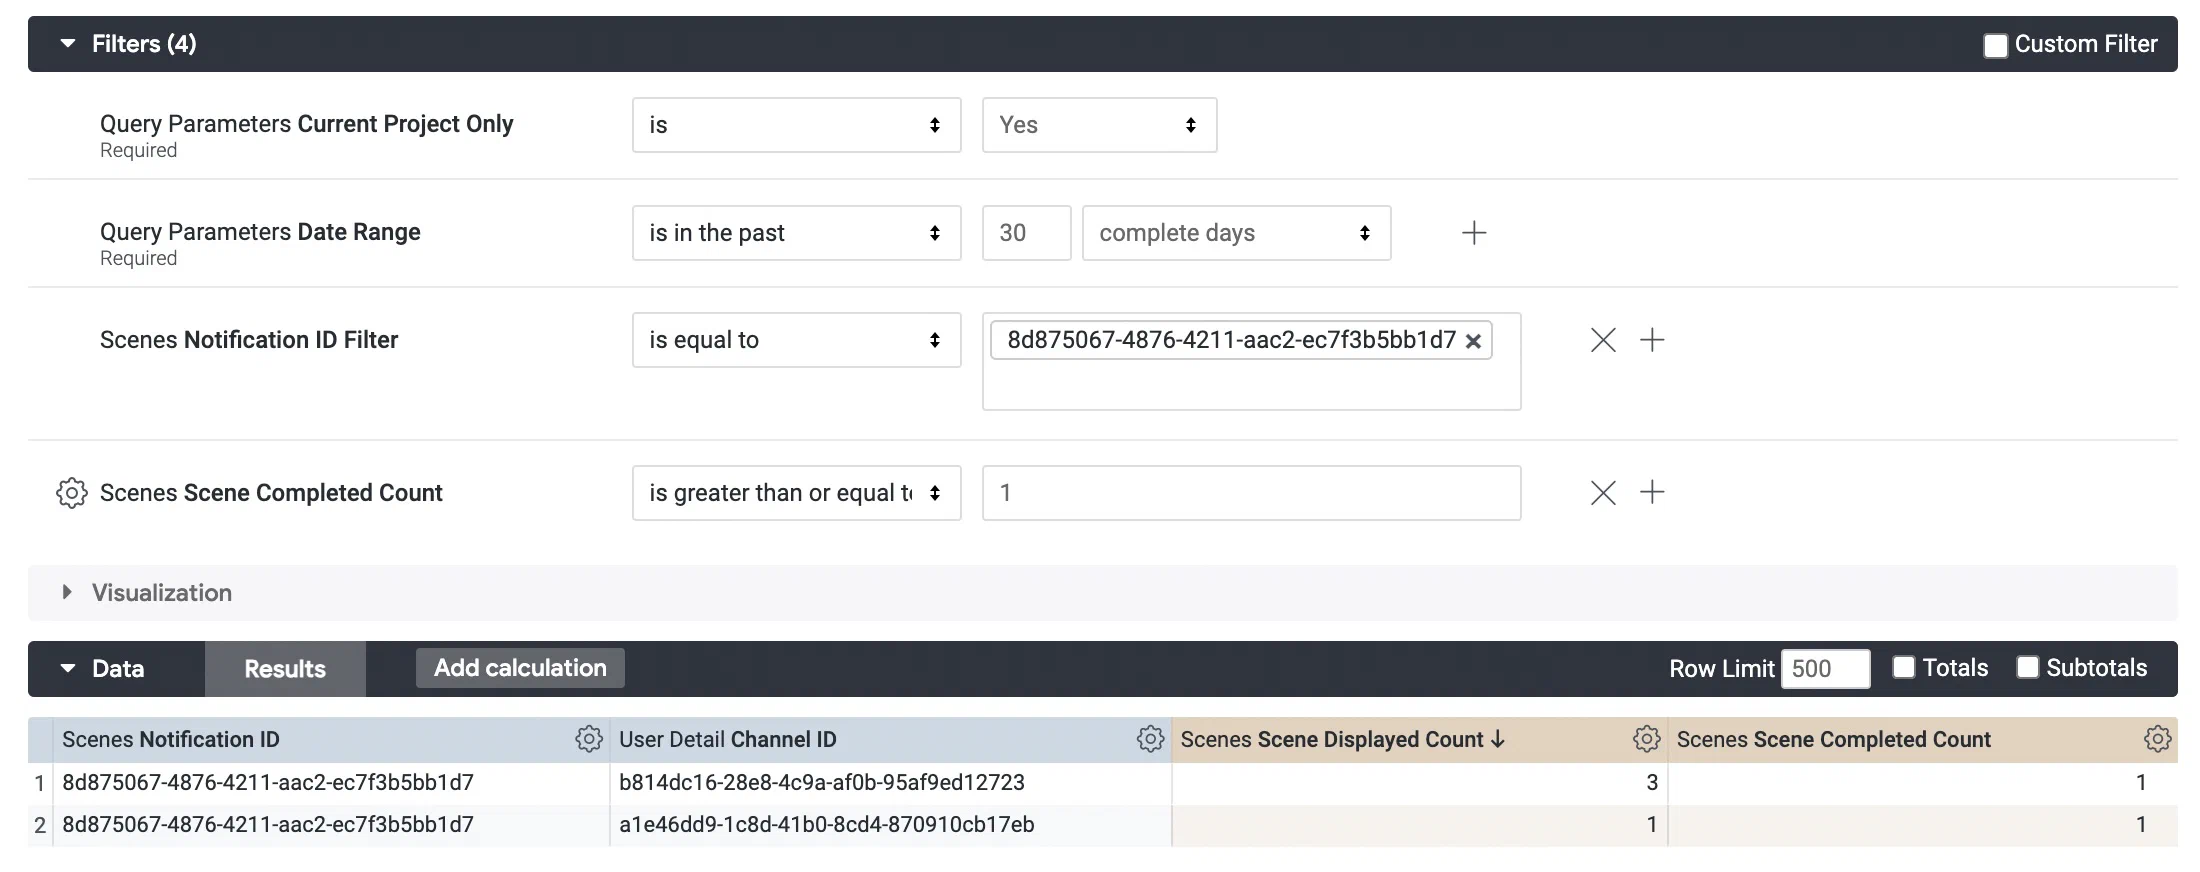 *Using the Scenes Explore to identify who completed a Scene* ### Find relevant screens Follow these steps to identify which screen is the most relevant to users and which generates churn. First, get the [Push ID](https://www.airship.com/docs/reference/glossary/#push_id) for the Scene you want information about:pushdetail/ in the URL. In this image, the ID is 644dae8d-4ff4-4688-9fe9-e7dac2138ea7:

*Copying the Push ID from the message report URL*Data availability depends on your Performance Analytics plan.
## Navigation To access the Explore: 1. Go to **Reports**, then **Performance Analytics**. 1. Select the folder icon (folder-simple), then **Shared**. 1. Under **Looks**, select **Explore Glossary** (**Explore Glossary EUCS** for EU customers). 1. Select **Tag Events**, then **Navigate to Explore**.For a list of all Explores in the glossary, see Predefined Explores in Exploring Performance Analytics data.
## Field categoriesThe sidebar lists categories for various filters, [Dimensions](https://www.airship.com/docs/reference/glossary/#pa_dimension), and [Measures](https://www.airship.com/docs/reference/glossary/#pa_measure) you can use to explore your data. To see their definitions, hover over an item, then select the info icon (ⓘ).
Field categories in the Tag Events Explore: | Category | Description | | --- | --- | | **Query Parameters** | Target all or specific projects, and specify dates and response windows, where relevant. | | **Tag Events** | Set Tag parameters for the query. | | **Tags Current** | Get Tag values associated with the channels at the time the report is run. | | **Tags Relative** | Get Tag values associated with the channels at the time the filtered Tag event occurred. | | **User Detail** | Get information about the channel that performed the filtered event. | | **User Detail - Derived** | Get historical information about the channel that performed the filtered event. | {class="table-col-1-20"} ### Default filtersUse filters to reduce the number of records scanned and results returned. Each Explore includes filters that cannot be removed from the query.
The filter name, [field category](#field-categories), and usage information for the default filters in the Tag Events Explore: | Filter name | Field category | Use the filter to... | |-------------|----------------|----------------------| | **Current Project Only** | Query Parameters | Determine which projects are included in the query. Default: **Yes**. To include other projects, 1) select **No**, 2) in the sidebar, select **Query Parameters**, 3) under **Dimensions**, select the filter icon (funnel-simple) next to **Project name**, and 4) in the Filters section, choose which projects to include. | | **Date Range** | Query Parameters | Target events that occurred on a specific date or within a specific date range. | | **Tag Action Filter** | Tag Events | Return Tags that were set, removed, or either. Use with operator **is**. Select one of: **Add**, **Delete**, **All**. | | **Tag Group Filter** | Tag Events | Specify the [Tag Group](https://www.airship.com/docs/reference/glossary/#tag_group) you want to return tags for. Default: **Notification Opt-in**. Must not be empty. Use with operator **is equal to**. | | **Tag Name Filter** | Tag Events | Return results for specific Tags. Enter Tags by name. Default value: **false**. Default operator: **is equal to**. To return all possible Tags for the filtered Tag Group, select the operator **is not null**. | {class="table-col-1-20 table-col-2-20"} The Tag Action, Group, and Name Filters include non-matched (null) records. To return matched records only, add the Tag Action, Tag Group, and Tag Name Dimensions from the Tag Events field category. ## Building custom queries The following sections walk you through using the Tag Events Explore to create custom queries that answer: * How can I get a list of all the Tags available under a specific Tag Group? How many users had these Tags added over the past 30 days? * How can I get a list of users that had a Tag added after interacting with a button in an [In-App Automation](https://www.airship.com/docs/reference/glossary/#iaa)? ### Get Tags in a Tag Group Follow these steps to get a list of Tags in a Tag Group and the number of users who had the Tag set over the past 30 days. We only need to use the default filters. > **Note:** * This report does not return whether or not users still have the Tag set. To return that data, use the [Audience with Attributes Explore](https://www.airship.com/docs/guides/reports/analytics/exploring/exploring/#predefined-explores). > * If a Tag does not appear for selection in Performance Analytics, it means that no add or remove event has occurred for the Tag during the specified time range. First, [open the Tag Events explore](#navigation), and then configure your query: 1. Set up the filters: 1. Leave **Current Project Only** set to `is Yes`. 1. Set **Date Range** to `is in the last 30 complete days`. 1. Leave **Tag Action** set to `Add`. 1. Set **Tag Group** to the Tag Group you want to return Tags for. 1. Set the **Tag Name** operator to `is not null`. 1. In the sidebar, specify the value and measurement to display: 1. Select **Tag Events**, then select the Dimension **Tag Name**. 1. Select **User Detail**, then select the Measure **User Count**.Now you are ready to get your data. Select Run, and you should see results similar to the below image. To save your custom query for later access, follow the steps in Saving Performance Analytics queries.
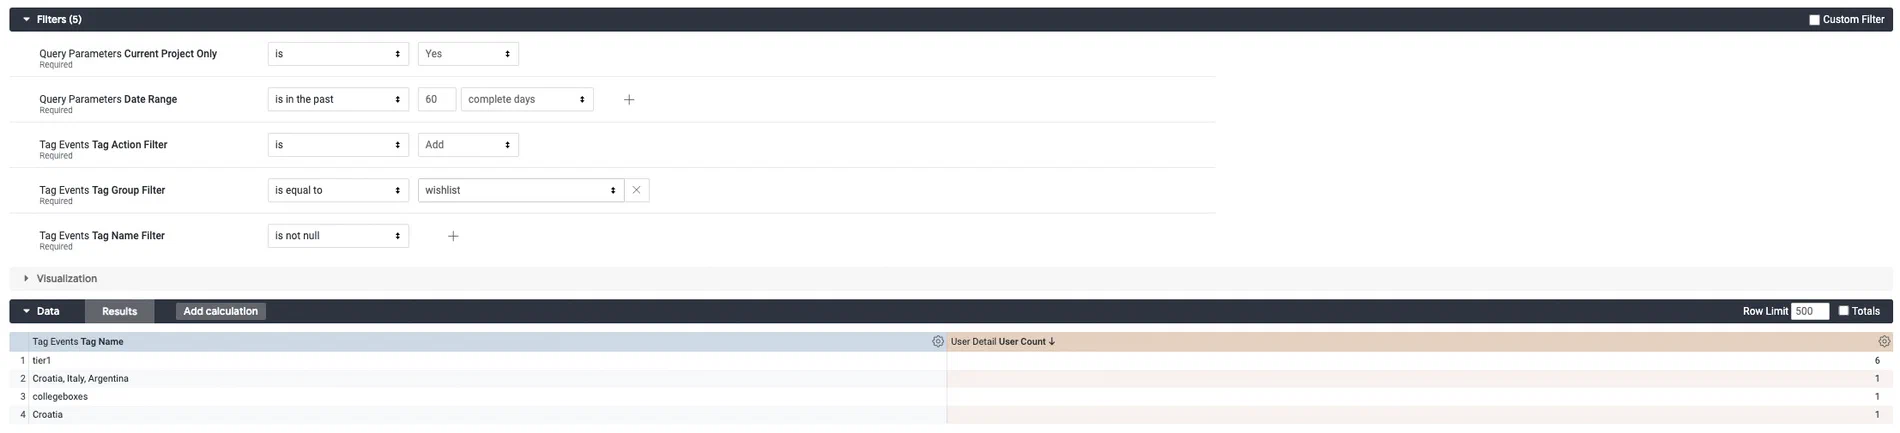 *Creating a custom query from the Tag Events Explore* ### Get Tag adds for button interaction Follow these steps to get a list of users that had a Tag added after interacting with a button in an [In-App Automation](https://www.airship.com/docs/reference/glossary/#iaa). We only need to use the default filters. You must know the name of the Tag for the button interaction. Users will be identified by [Channel ID](https://www.airship.com/docs/reference/glossary/#channel_id). First, [open the Tag Events explore](#navigation), and then configure your query: 1. Set up the filters: 1. Leave **Current Project Only** set to `is Yes`. 1. Set **Date Range** to a range that makes sense for your query. 1. Leave **Tag Action** set to `is Add`. 1. Set **Tag Group** to the Tag Group containing the Tag you want results for. 1. Set the **Tag Name** operator to `is equal to` and select the Tag associated with the button interaction. 1. In the sidebar, specify the value and measurement to display: 1. Select **Tag Events**, then select the Dimension **Tag Name**. 1. Select **User Detail**, then select the Dimension **Channel ID** and Measure **User Count**. If you're using [Named Users](https://www.airship.com/docs/reference/glossary/#named_user) in your project, you can also add the Dimension **Named User** to identify these users in your database. Now you are ready to get your data. Select **Run**, and you should see results similar to the below image. To get count of users, select **Totals** in the **Data** header. To save your custom query for later access, follow the steps in [Saving Performance Analytics queries](https://www.airship.com/docs/guides/reports/analytics/tasks-queries/saving-queries/). 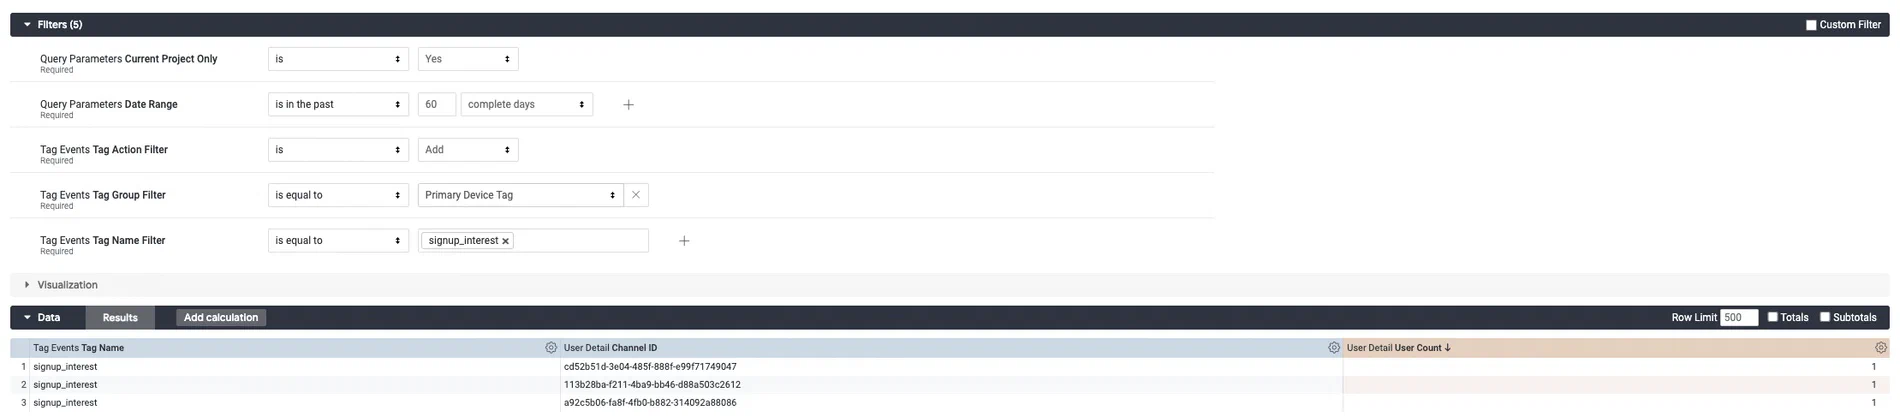 *Creating a custom query from the Tag Events Explore*