Data availability depends on your Performance Analytics plan.
## Navigation To access the Explore: 1. Go to **Reports**, then **Performance Analytics**. 1. Select the folder icon ( ), then **Shared**. 1. Under **Looks**, select **Explore Glossary** (**Explore Glossary EUCS** for EU customers). 1. Select **Device Events**, then **Navigate to Explore**.For a list of all Explores in the glossary, see Predefined Explores in Exploring Performance Analytics data.
## Field categoriesThe sidebar lists categories for various filters, [Dimensions](https://www.airship.com/docs/reference/glossary/#pa_dimension), and [Measures](https://www.airship.com/docs/reference/glossary/#pa_measure) you can use to explore your data. To see their definitions, hover over an item, then select the “i” icon ( ).
Field categories in the Device Events Explore:| Category | Description |
|---|---|
| Attributes Current | Get Attribute values associated with the channels at the time the report is run. |
| Attributes Relative | Get Attribute values associated with the channels at the time filtered event occurred. |
| Device Events | Set device event parameters for the query. |
| Device Properties Current | Get device property values associated with the channels at the time the report is run. |
| Device Properties Relative | Get device property values associated with the channels at the time filtered event occurred. |
| Query Parameters | Target all or specific projects, and specify dates and response windows, where relevant. |
| Tags Current | Get Tag values associated with the channels at the time the report is run. |
| Tags Relative | Get Tag values associated with the channels at the time filtered event occurred. |
| User Detail | Get information about the channel that performed the filtered event. |
| User Detail - Derived | Get historical information about the channel that performed the filtered event. |
Use filters to reduce the number of records scanned and results returned. Each Explore includes filters that cannot be removed from the query.
The filter name, [field category](#field-categories), and usage information for the default filters in the Device Events Explore:| Filter name | Field category | Use the filter to... |
|---|---|---|
| Current Project Only | Query Parameters |
Determine which projects are included in the query. Default selection: Yes. To include other projects within your company, select No, then:
|
| Date Range | Query Parameters | Target events that occurred on a specific date or within a specific date range. |
| Event Type Filter | Device Events | Return results for a specific event type. Default selection: App Session. Other possible selections: Install, Uninstall, Web Session, SMS First Opt-In, Email First Opt-In, or All. |
Now you are ready to get your data. Select Run, and you should see results similar to the below image. To save your custom query for later access, follow the steps in Saving Performance Analytics queries.
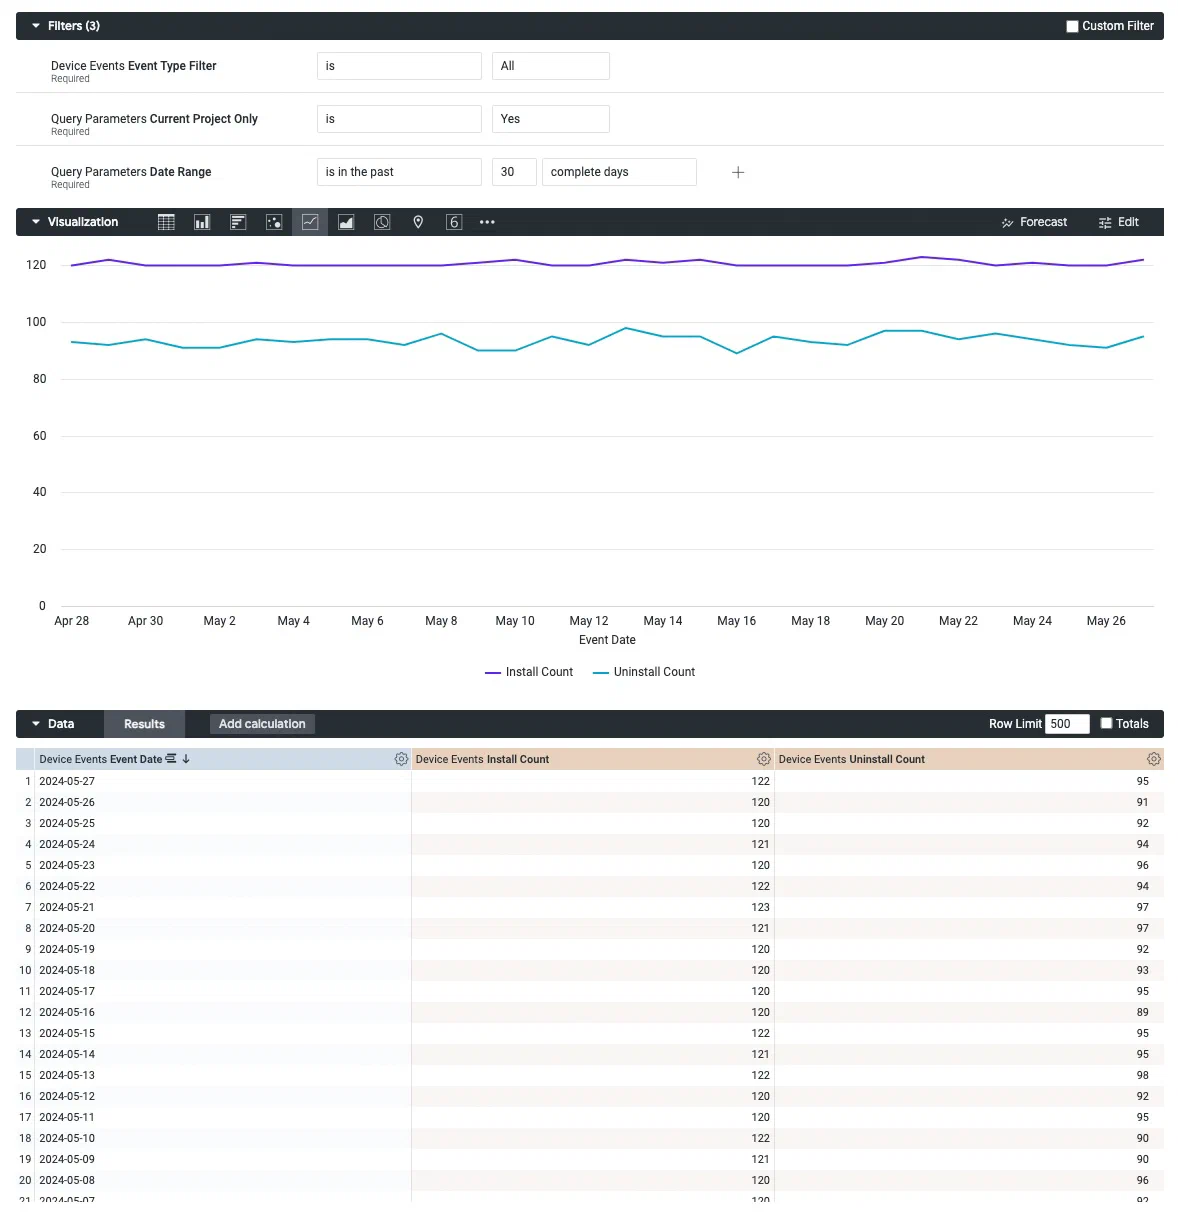 *Creating a custom query from the Device Events Explore* ### Find the most active hour Follow these steps to determine the hour of the day when your users are the most active. First, [open the Device Events explore](#navigation), and then configure your query: 1. Set up the filters: 1. Leave **Event Type Filter** set to `is App Session`. 1. Leave **Current Project Only** set to `is Yes`. 1. Set **Date Range** to `is in the last 30 complete days`. 1. In the sidebar, specify values and measures to display: 1. Select **Device Events**, then the Dimension **Event Date**, then **Hour of Day**. 1. Also in **Device Events**, select the Measure **App Session Count**. 1. Select the **Column** visualization format to display the report as a column chart / bar graph.Now you are ready to get your data. Select Run, and you should see results similar to the below image. To save your custom query for later access, follow the steps in Saving Performance Analytics queries.
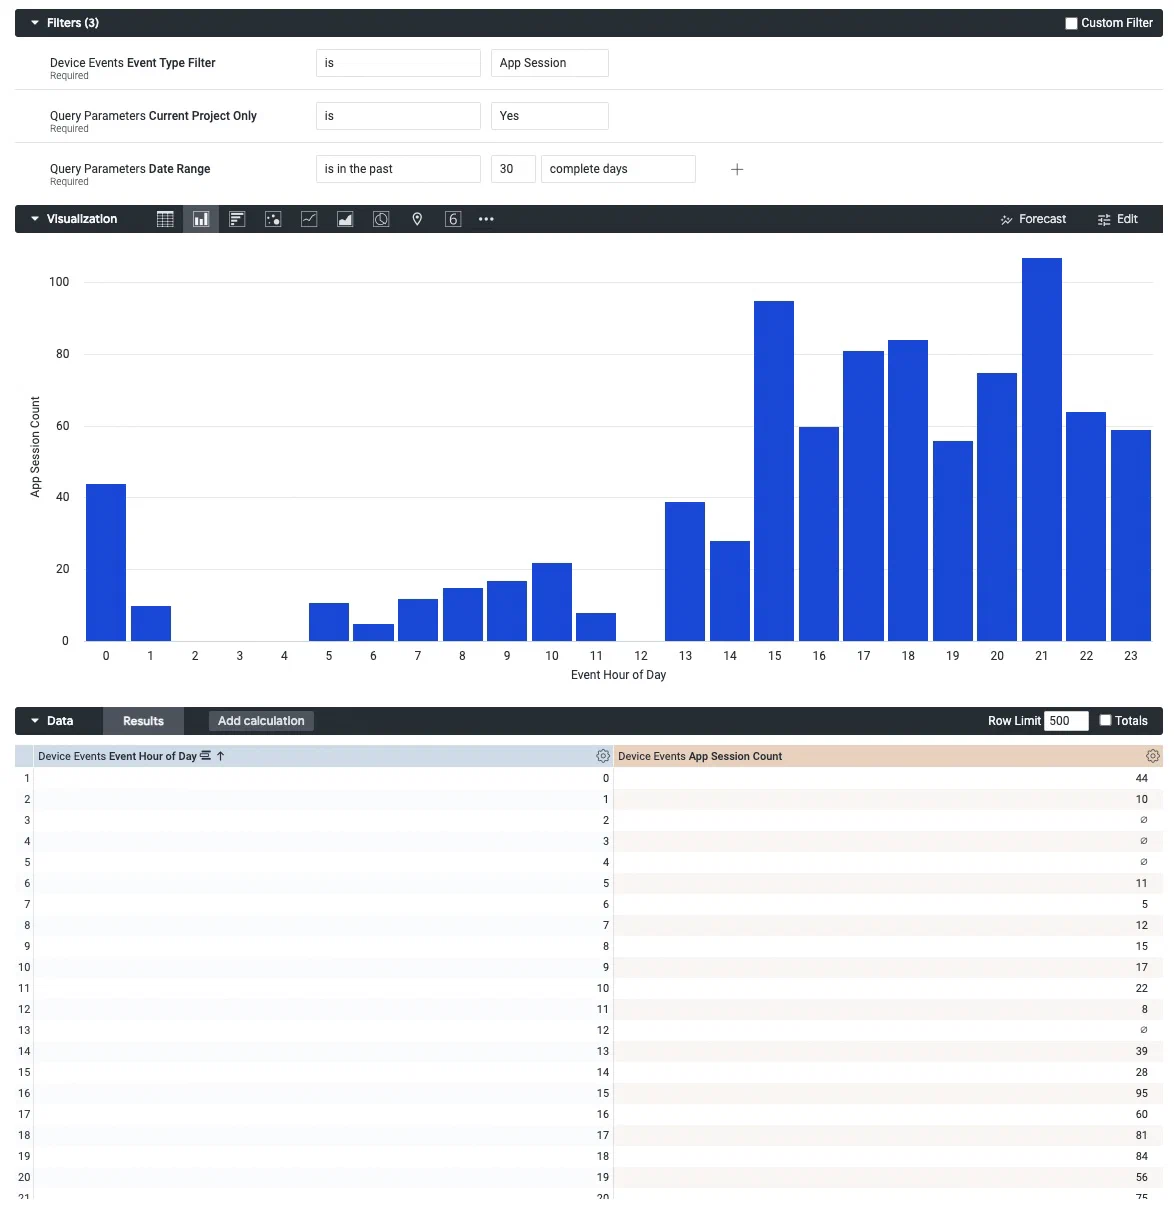 *Creating a custom query from the Device Events Explore*