Data availability depends on your Performance Analytics plan.
## Navigation To access to the Explore: 1. Go to **Reports**, then **Performance Analytics**. 1. Select the folder icon ( ), then **Shared**. 1. Under **Looks**, select **Explore Glossary** (**Explore Glossary EUCS** for EU customers). 1. Select **Audience with Attributes**, then **Navigate to Explore**.For a list of all Explores in the glossary, see Predefined Explores in Exploring Performance Analytics data.
## Field categoriesThe sidebar lists categories for various filters, [Dimensions](https://www.airship.com/docs/reference/glossary/#pa_dimension), and [Measures](https://www.airship.com/docs/reference/glossary/#pa_measure) you can use to explore your data. To see their definitions, hover over an item, then select the “i” icon ( ).
Field categories in the Audience with Attributes Explore:| Category | Description |
|---|---|
| Attributes | Set Attribute parameters for the query. |
| Device Properties | Get device property values associated with the channels at the time the report is run. |
| Query Parameters | Target all or specific projects, and specify dates and response windows, where relevant. |
| Report Over Time | Add filters and Dimensions to report historical data. |
| Tags | Get Tag values associated with the channels at the time the report is run. |
| User Detail | Get information about the channel that performed the filtered event. |
Use filters to reduce the number of records scanned and results returned. Each Explore includes filters that cannot be removed from the query.
The filter name, [field category](#field-categories), and usage information for the default filters in the Audience with Attributes Explore:| Filter name | Field category | Use the filter to... |
|---|---|---|
| Current Project Only | Query Parameters |
Determine which projects are included in the query. Default selection: Yes. To include other projects within your company, select No, then:
|
| Current Audience Only | Report Over Time | Determine whether or not to return your audience's current values only. Default selection: Yes. Select No to also return historical values. |
Now you are ready to get your data. Select Run, and you should see results similar to the below image. To save your custom query for later access, follow the steps in Saving Performance Analytics queries.
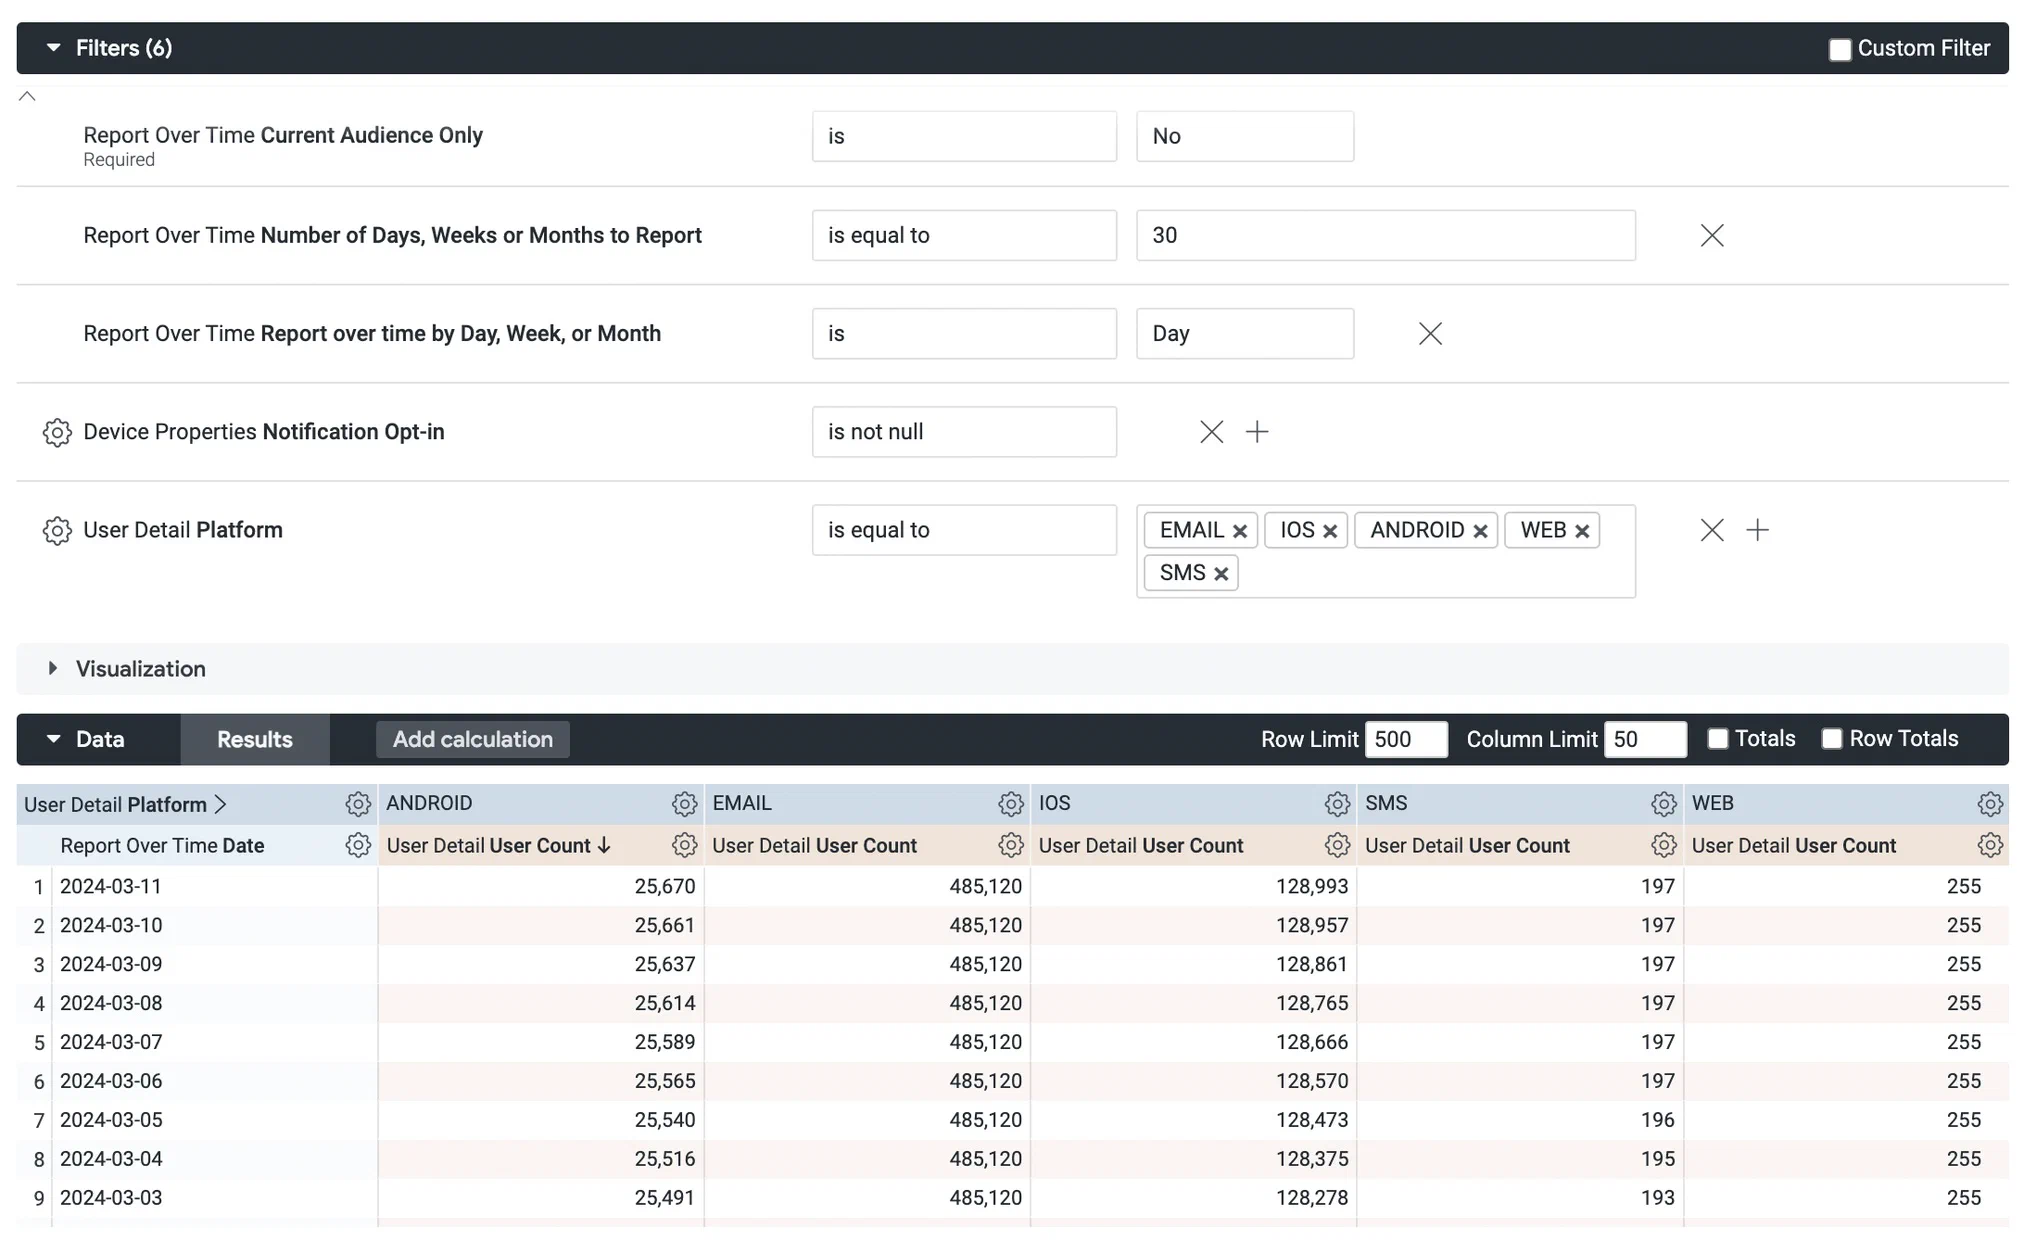 *Creating a custom query from the Audience with Attributes Explore* ### Find Tags and opt-outs Follow these steps to find which Tags in a Tag Group users subscribe to the most and how many opted out of push notifications. First, [open the Audience with Attributes explore](#navigation), and then configure your query: 1. Set up the filters: 1. Leave **Current Project Only** set to `is Yes`. 1. Leave **Current Audience Only** set to `is Yes`. 1. In the sidebar, select **Device Properties**, then **Notification Opt-in Filter**. 1. Set **Notification Opt-in Filter** to `is not null`. 1. In the sidebar, select **Tags**, then **#1 Tag Group Filter**. Then set it to `is equal to` and enter the name of the Tag Group you want to return Tags for. 1. (Optional, to return specific tags in the filtered Tag Group) In the sidebar, select **Tags**, then **#1 Tag Name Filter**. Then set it to `is equal to` and enter the names of Tags in the Tag Group. 1. In the sidebar, specify values and measurements to display: 1. Select **Tags**, then select the Dimensions **#1 Tag Group** and **#1 Tag Name**. 1. Select **User Detail**, then select the Measure **User Count**. 1. 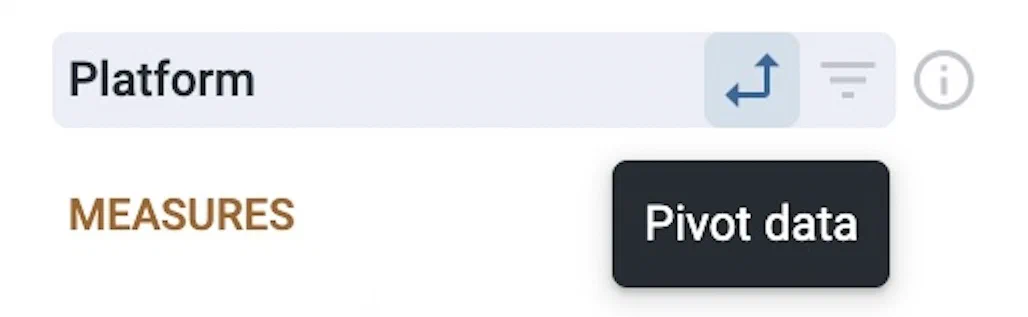 *Selecting the option to pivot data* Select **Device Properties**, then select the Dimension **Notification Opt-in**, then select the double-arrow icon next to **Notification Opt-in**. The pivot option adds detailed metrics for each platform and makes it more readable. 1. In the **Data** header, select the **Row Totals** check box to display the sum of opted in and opted out channels that have each Tag.Now you are ready to get your data. Select Run, and you should see results similar to the below image. To save your custom query for later access, follow the steps in Saving Performance Analytics queries.
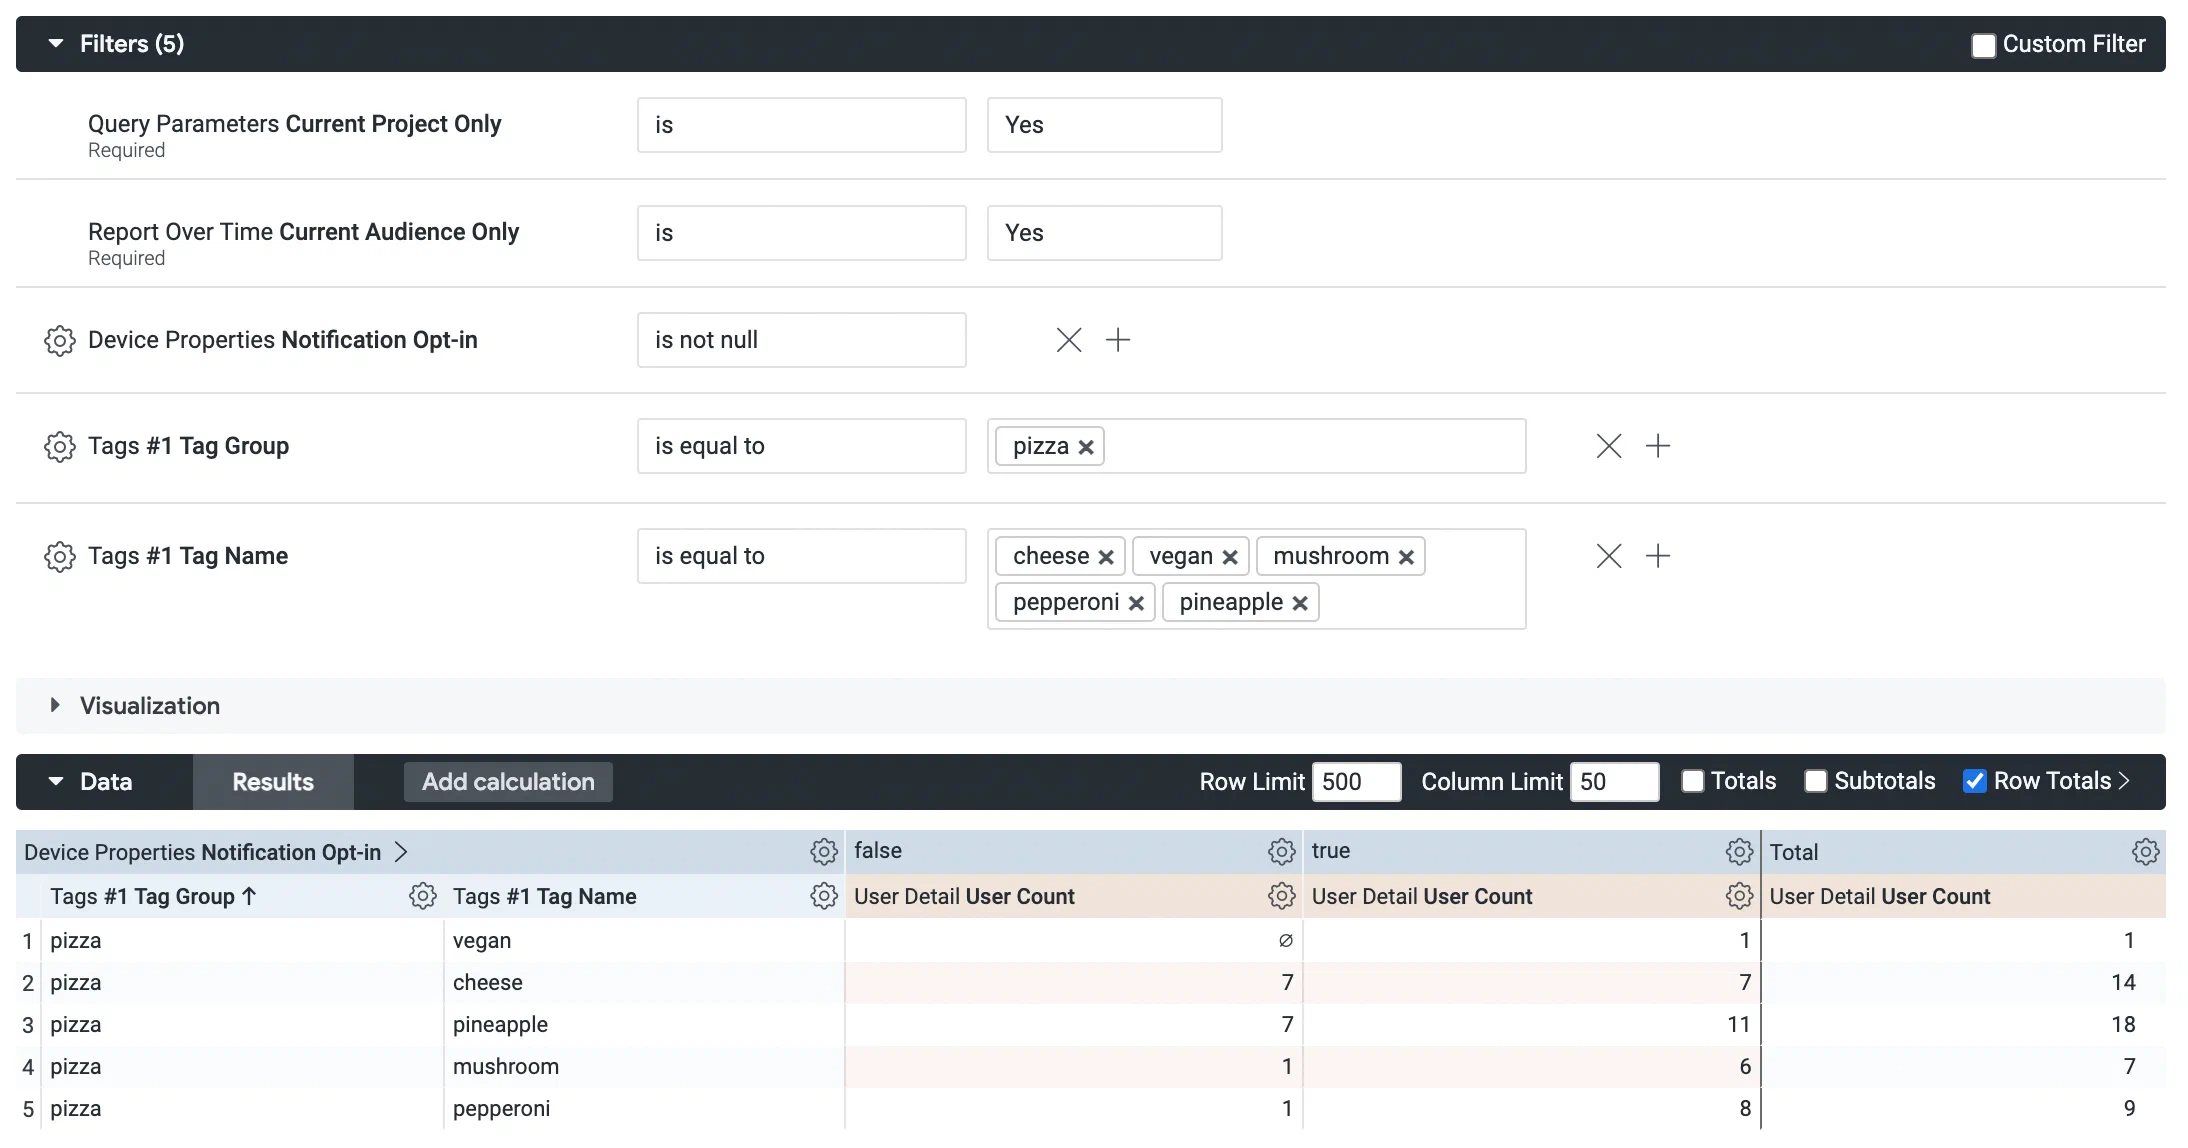 *Creating a custom query from the Audience with Attributes Explore*