# Common tasks and queries
Learn how to export lists, report on funnels and paths, and more.
# Saving Performance Analytics queries
> You can save any query for later access, either as a Look or to a new or existing Dashboard.
Start from the [Explore view](https://www.airship.com/docs/guides/reports/analytics/exploring/exploring/#the-explore-view). If you are starting from a Look or Dashboard, hover over the Look, then click the more menu icon (⋮) and select *Explore from here* to open the Explore view.
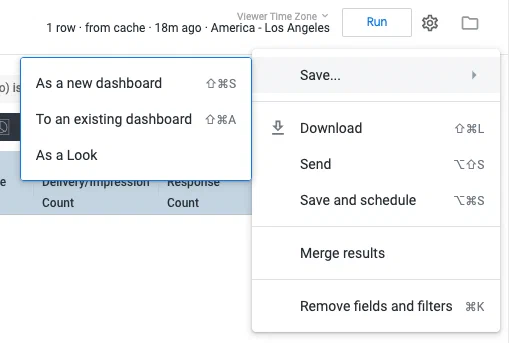
*Saving a query in Performance Analytics*
From the Explore view, click the gear icon (⚙), then select *Save as...* and choose a format/location:
* *Existing Dashboard* — Enter a title, select a Dashboard, then click **Save to Dashboard**.
* *Look* or *New Dashboard* — Enter a title, select a folder, then click **Save** or **Save & View Look**. Folder options:
* *My folder* — No one else in your Airship project has access to the content in this folder.
* *Group* — Anyone with access to your Airship project and Performance Analytics can access this folder. If you would like
to save Looks and Dashboards across multiple projects, use this folder.
# Scheduling delivery of Performance Analytics data
> Export your Performance Analytics data single time or at repeated intervals using various methods, formats, and other options.
> **Important:** **Best Practice**
>
> Since Performance Analytics is an on-demand system, it is important that your
> scheduled requests do not adversely impact other customers. When scheduling an
> export of user-level data:
>
> 1. Filter appropriately so that results are not excessive or a larger data
> set than necessary.
> 1. Select a weekend day to limit your impact on other users.
>
> If you are interested in integrating with other business systems, we highly
> recommend using our
> [Real-Time Data Streaming](https://www.airship.com/docs/reference/glossary/#rtds)
> integrations, which will scale to your needs. See:
> [Integrations](https://www.airship.com/docs/integrations/).
>
> ---
>
> **Excessive Exports**
>
> Event data, such as messages, clicks, and tag events, is updated about every hour, depending on the volume of data. Channel state data, such as tags and attributes associated to a channel, is updated every night. Any scheduled data exports exceeding these time frames will be considered excessive and could be removed.
## Scheduling Look Delivery
You can only schedule delivery of saved Looks. If you edited a Look and want to schedule delivery, first save it as a new Look, then complete these steps. Refer to [Scheduling Options](#scheduling-options) below for detail.
From a Look:
1. Hover over the Look, then click the more menu icon (⋮) and select *Schedule*.
1. Enter a name for the schedule.
1. Select and configure the destination:
* *Email* — Your account's email address is populated by default. For each additional recipient, enter the email address and **click Add**. You can also include a custom message that will appear above the data in the email.
* *Webhook* — Enter the webhook URL.
* *Amazon S3* — Enter the S3 values for the bucket and optional path, access key, and secret key, then select a region.
* *SFTP* — Enter the host address, e.g., *sftp://example.com/home/ftpuser/*, and the SFTP user username and password, then select your preferred key exchange algorithm.
1. Select a data format.
1. Set the recurrence interval, or select *Datagroup update* and select a datagroup.
1. (Optional) Edit or configure *Filters*: Specify the date range and project name and add more filters.
1. (Optional) Configure *Advanced options*. These options control the delivery logic based on data presence and changes, limits on output, visual output, paper size, and time zone.
1. (Optional) Click **Send Test** to preview before saving. It will send according to the current settings.
1. Click **Save All**.
## Scheduling Dashboard Delivery
Refer to [Scheduling Options](#scheduling-options) below for detail.
From a Dashboard:
1. Click the more menu icon (⋮) and select *Schedule delivery*.
1. Configure the *Settings* tab:
1. Enter a name for the schedule.
1. Set the recurrence interval, or select *Datagroup update* and select a datagroup.
1. Select and configure the destination:
* *Email* — Your account's email address is populated by default. For each additional recipient, enter the email address and hit Enter or click outside the field.
* *Webhook* — Enter the webhook URL.
* *Amazon S3* — Enter the S3 values for the bucket and optional path, access key, and secret key, then select a region.
* *SFTP* — Enter the host address, e.g., *sftp://example.com/home/ftpuser/*, and the SFTP user username and password, then select your preferred key exchange algorithm.
1. Select a data format. Available options depend on your selected destination and whether you are scheduling a Look or a Dashboard.
1. (Optional) Edit or configure the *Filters* tab: Specify the date range and project name and add more filters.
1. Configure the *Advanced options* tab. These options control the visual output, paper size, and time zone.
1. Click **Save now**.
## Scheduling Options
These options are available when configuring scheduling.
### Destinations
* *Email* — The data is delivered to the email addresses entered.
* *Webhook* — Webhooks are a modern, increasingly common way to trigger exchanges between
internet based services. They generally require some technical or developer
knowledge to use, but with a product like [Zapier](https://zapier.com/),
webhooks can let Performance Analytics data be delivered to a wide range of locations. Only
a webhook URL is required.
* *Amazon S3* — Amazon S3 buckets are a common way to store large amounts of data. Options include:
* *Limits* — If you choose "Results in Table", whatever row limitations you've set up in the saved Look will be obeyed. If you choose "All Results" all the rows of the query will return, regardless of the saved Look settings, and regardless of the typical 5,000 row limit for Performance Analytics. This can be desirable for retrieving very large datasets, but you should use caution to ensure the query is not too large for your database.
* *SFTP* — The data is uploaded according to your server.
### Formats
Dashboards support these output formats:
* CSV
* PDF
* PNG visualization
For Looks, supported formats depend on the destination:
| Format | Email | Webhook | S3 | SFTP |
| --- | :---: | :---: | :---: | :---: |
| CSV | ✓ | ✓ | ✓ | ✓ |
| Text | ✓ | ✓ | ✓ | ✓ |
| XLSX | ✓ | ✓ | ✓ | ✓ |
| JSON — Simple | ✓ | ✓ | ✓ | ✓ |
| HTML | ✓ | | ✓ | ✓ |
| JSON — Detailed, Inline | | ✓ | ✓ | ✓ |
| JSON — Simple, Inline | | ✓ | | |
| JSON - Label | | ✓ | | |
| Data Table1 | ✓ | | | |
| Visualization1 | ✓ | | | |
1. Sent in the body of the email.
# Add Web Metrics To a Report
> Add web metrics to a report.
Add web push notification metrics to the *Message Report by Platform* report, and save the
customized version in your Personal or Group space.
1. Go to *Reports » Performance Analytics*.
1. Go to any report or dashboard.
1. Click the grid icon (squares-four), click the globe icon (globe), and then go to *Messages » Message Report by Platform*.
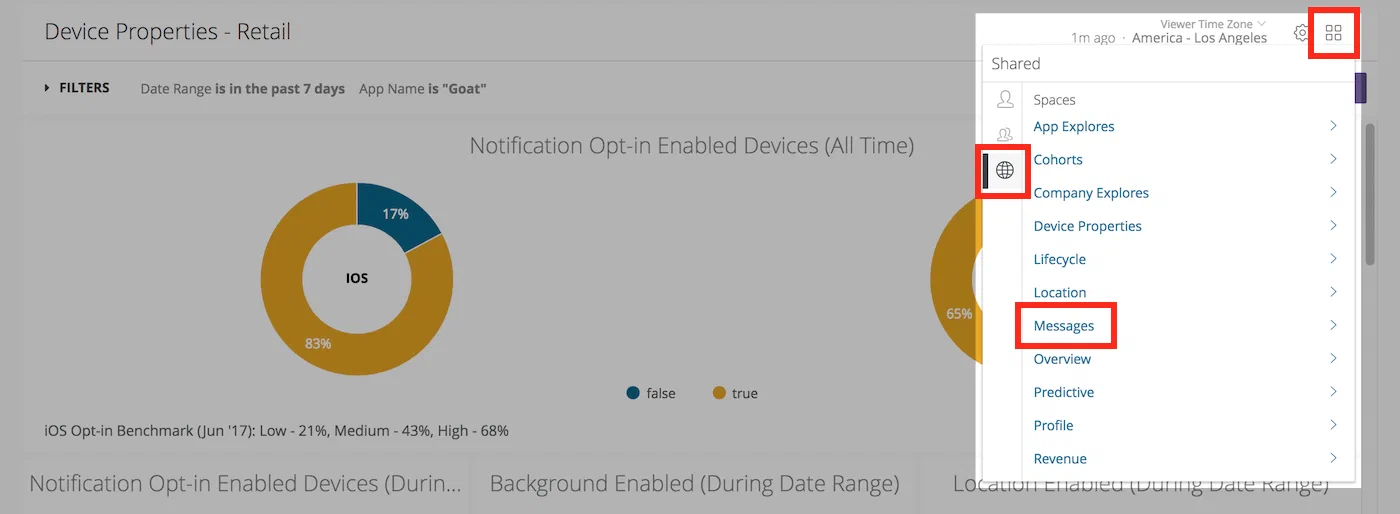
*Navigating to the Message Report by Platform Look*
1. Click the gear icon (⚙) and select *Explore from Here*.
1. In *Filters*, set *Message Type* to `Web Notification`.
1. From the left side menu, in *Messaging Metrics » Measures » Web Metrics*, click the rows for:
* Web Click Rate
* Web Click Count
* Web Session Rate
* Web Session Count
1. Click the gear icon (⚙) and select *Save as a Look*.
1. Enter a *Title* and *Description*, select the *Personal* or *Group*
space, then click **Save** or **Save & View Look**.
# Export Lists
> Learn the general process of exporting Performance Analytics data and review specific examples.
All data in Performance Analytics can be exported in a number of formats via the download
feature. In this document we'll look at the general process of exporting
Performance Analytics data, then we'll examine the specific example of exporting a list of
users that have directly opened a notification or rich message.
In this tutorial, you will first learn how to export report data, then follow steps to export specific types of report data.
## Export Data
In this section we look at the general process of exporting Performance Analytics data.
1. Go to *Reports » Performance Analytics*.
1. Select a dashboard and find the report you would like to download.
1. If you are on a default dashboard, click the more menu icon (⋮) and select
*Download Data...*. If you clicked the tile to open the report or opened
the report from a Space, instead click **Download Results**.
1. Specify Download Options:
* **File Format:** The format of the download: *TXT*, *Excel
Spreadsheet*, *CSV*, *JSON*, *HTML*, *Markdown*, or *PNG (Image of
Visualization)*.
* **Results:** *With visualization options applied* or *As displayed in the data table*.
* **Values:** *Unformatted* means special characters are truncated
from values, and values will be rounded to the nearest integer, e.g.,
"1.13%" is rounded to "1%". As a general rule, the *Unformatted* option
is good for discrete values, e.g., a count of devices, while *Formatted*
is a good option for non-discrete values, such as percentages.
* **Limit:** *Results in Table* exports all results currently visible
in the table. *All Results* exports every result fetched by the query.
Select *Custom*, to define a cutoff row for the download, e.g., enter
*5000* to download of the first 5,000 records.
* **Filename:** Enter a descriptive filename.
1. Click **Download** and save the file. If you'd like to view the
data in the browser instead, click **Open in Browser**, and it
will open in a new browser tab.
## Notifications
Generate a list of users that directly opened a specific push notification.
1. Go to *Reports » Performance Analytics*.
1. Select the *Revenue* dashboard.
1. In the *Messages* report, locate the row for the message
you want to analyze, then click its value in the *Direct Response Count*
column.
1. Download the data as described in
[Export Data](#export-data).
## Rich Pages
Generate a list of users that directly opened a specific rich message.
1. **Go to the Messages dashboard.**
1. In the *Top 50 Rich App Pages* report, **locate the row for the Message you
want to analyze**, then **click its value in the *Read Count*
column.**
1. **Click the arrow next to Filters to display the full menu.**
1. **Edit the Rich Pushes Occurred Date range**, and set the value of *is on
or after* to the day before the message send date:
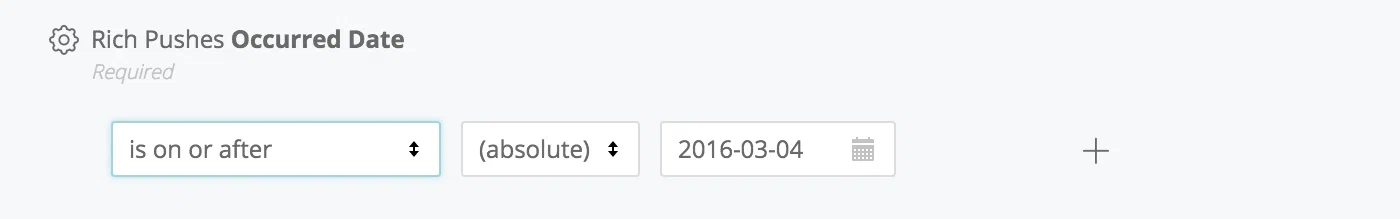
*Setting the Rich Pushes Occurred Date filter*
This configuration is necessary to ensure you capture rich message reads
occurring in every time zone.
1. **Click the Run button** to refresh the query.
1. **Download the data** as described in
[Export Audience Lists](#export-audience-list).
## Ad IDs {#ins-tutorial-ad-ids}
Generate a list of Ad IDs for users that made a purchase. Please visit our
[Ad IDs topic guide](https://www.airship.com/docs/guides/audience/ad-ids/) for use cases and
technical details.
> **Warning:** Your app must:
>
> 1. Send the *limit ad tracking* field from your app, and
> 1. Not target users with ads who have *limit ad tracking* enabled. A value of
> Unknown or Limit Ad Tracking = Yes or Unknown means you cannot send
> ads to these users.
1. Go to *Reports » Performance Analytics*.
1. Select the *Revenue* dashboard.
1. In the *Custom Events Table* report, locate the *purchased* row and click
its value in the *Event Count* column.
1. Click **Explore from Here**.
1. Make these changes in the left side menu:
* In *Custom Events » Dimensions*, click the row for *Platform*.
* In *User IDs » Dimensions*, click the row for *Device ID* to
unselect it, and click the row for *Ad ID*.
* Click **Filter** for *Limit Ad Tracking Enabled* to add
the row to the Filters menu, then set the value of *is equal to* to "No."
1. Download the data as described in
[Export Data](#export-data).
1. (Optional) Create a custom audience on Facebook. Follow
[Facebook's instructions: Create a Customer List Custom Audience](https://www.facebook.com/business/help/170456843145568?id=2469097953376494)
to create a Custom Audience or Lookalike Audience using the downloaded
file. File must be in TXT or CSV format.
## Export Audience Lists {#export-audience-list}
You can [segment your audience](https://www.airship.com/docs/guides/audience/segmentation/segmentation/) using
an [Uploaded List](https://www.airship.com/docs/reference/glossary/#uploaded_list). First,
follow these steps to download a CSV of device identifiers. Second, [upload the list of users](https://www.airship.com/docs/guides/audience/segmentation/audience-lists/uploaded/##uploading-your-list) to your project, using the
file you just downloaded.
This example downloads all your Daily Active Users,
1. Go to *Reports » Performance Analytics*.
1. Select the *Overview* dashboard.
1. In the *Daily Active Users* report, click its value.
1. Click **Explore from Here**.
1. Download the data as described in
[Export Data](#export-data), using these values:
* **File Format**: CSV
* **Values**: Unformatted
* **Limit**: All Results
# Find In-App Impression Rate
> Finding your in-app impression rate.
To find the in-app impression rate, we need to add two Measures to the Messages Look.
- Go to Reports, then Performance Analytics, and then select the Messages Dashboard.
- For the Messages Look, select the more menu icon (⋯), and then select Explore from here.
- In the sidebar, select Message Metrics, then Measures, and then In-App Impression Metrics.
- Select the filter icon (funnel-simple) next to:
- In-App Impression Rate
- In-App Dismissed User Rate
- Select Run.
# Find Inactive Users
> Find your inactive users.
## Reports and Filters for Inactive Users
Inactive User reports are available in the [Overview Dashboard](https://www.airship.com/docs/guides/reports/analytics/definitions/#overview).
Users inactive in the last day
: The number of unique users that were not active 1 day ago but were active
in the 6 days prior.
Users inactive in the last 7 days
: The number of unique users that were not active in the last 7 days but were
active in the 14 days prior.
Users inactive in the last 30 days
: The number of unique users that were not active in the last 30 days but were
active in the 30 days prior.
An Inactive Users report uses two date range filters:
* **App Open Date** is used to look at a window of activity for users that opened the app.
For example, for *Users inactive in the last day*, this filter is set to "is in the last
7 complete days."
* **Last Seen Date** is used to pick a relative point in time in which to filter out users
that have only been seen before the chosen date. For example, for *Users inactive in the
last day*, this filter is set to "is before (relative) 1 day ago."
## Filter for Last Seen Date
1. Go to *Reports » Performance Analytics*.
1. Select the *Overview* Dashboard.
1. Click the more menu icon (⋮) for an Inactive Users report and select *Explore From Here*.
1. In *Filters*, set the Last Seen Date filter to `is any time`.
1. In *Visualization*, select *Column*.
1. Make these changes in the left side menu:
* In *Inactive Users » Dimensions*, under *Last Seen Date*, click
**Filter** next to *Date*.
1. Click **Run**.
Now you can see the days in which the *Last Seen Date* for users was the
highest and better understand why that may have been the last time they were
in your app.
## Show Uninstalls
To see which inactive users have uninstalled in the period after their last
seen activity, follow these steps after completing the steps in
[Filter for Last Seen Date](#filter-for-last-seen-date):
1. Make these changes in the left side menu:
* In *Inactive Users » Dimensions*, click **Filter** for *Has
Installed (Yes / No)*.
1. In *Filters*, set the Has Installed (Yes / No) filter to `is Yes`.
1. Click **Run**.
# Get a list of tags added for a channel ID or named user
> You can use Airship Performance Analytics to retrieve a list of tags for a given channel ID or a named user.
1. Go to *Reports » Performance Analytics*.
1. Select the *Profile* dashboard.
1. Click *Top 50 Device Tags Added (During Date Range)* to explore.
1. In the left side menu, under *User IDs*, click *Filter by field* next to *Channel ID* or *Named User*.
1. In the *Filters* section, enter the identifier in the *User IDs* section.
1. Click **Run**.
> **Tip:** If the user has more than 50 tags, you can expand the number of rows by adjusting the row limit and clicking **Run** again.
# Get a list of users who were sent or opened an A/B test
> Use Performance Analytics to get an A/B test user list.
1. Go to **Messages**, then **Messages Overview**.
1. Change the search filter to *Composers*, then click the search field and choose *A/B Test*.
1. Click the report icon (
) for an A/B test.
1. Copy the push ID from the address bar. The push ID follows `abtest/` in the URL. In this image, the push ID is `cd15b020-5cb5-11ed-a8ad-0242170009c2`:

*Copying the push ID from the A/B test report URL*
1. Go to *Reports » Performance Analytics*.
1. Select the *Messages* dashboard.
1. In the *Messages* report, click the count for any message with a non-zero *Total Delivery/Impression Count*, then click **Explore from Here**. The message you select does not matter. This step is only to access the explore view.
1. In the left side menu, under *Message Content*, click *Filter by field* next to *Notification ID*.
1. Make these changes in the *Filters* section
* Change the *Notification ID* by pasting the push ID you copied in step 4.
* Set the *Workflow Type* to *A/B Test*.
* Remove the time range field or select a time range that is inclusive of the send/open date.
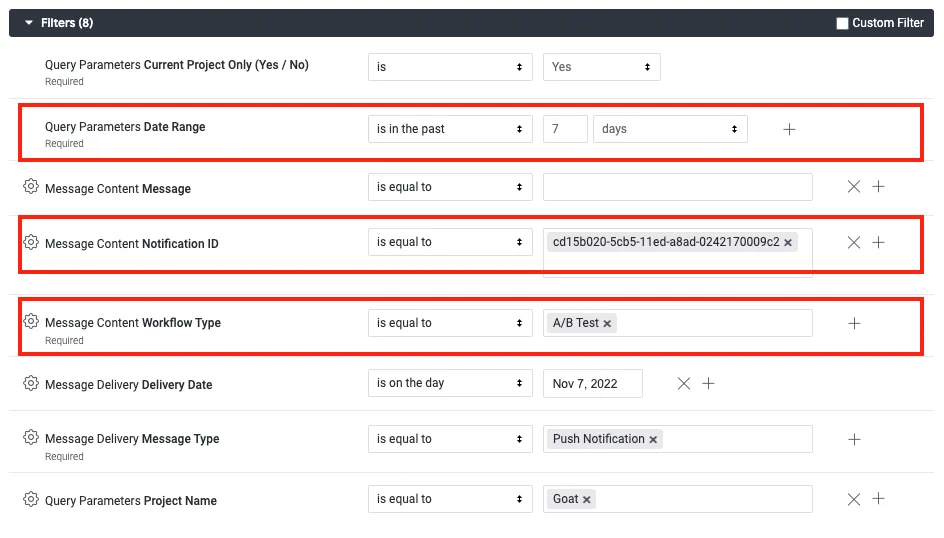
*Configuring A/B test filters in Performance Analytics*
1. Click **Run**.
# Report on Funnel and Path
> Learn how to create your own funnel and path reports.
This tutorial expands on templated funnels to show how you can create your
own funnel and path reports. These reports are powerful tools for analyzing the
behaviors of your users. Funnel and path are available for
[Custom Events](https://www.airship.com/docs/reference/glossary/#custom_event).
Since most users are unable to complete a goal in a single session, our
example funnel and path report shows goals achieved over a time range.
## Show Goals Achieved Over a Time Range {#goals}
1. Go to *Reports » Performance Analytics*.
1. Select the *Revenue* dashboard.
1. For the *Funnel* report, click the more menu icon (⋮) and select *Explore From Here*.
1. In *Filters*, edit the filters and values as desired, then click **Run**.
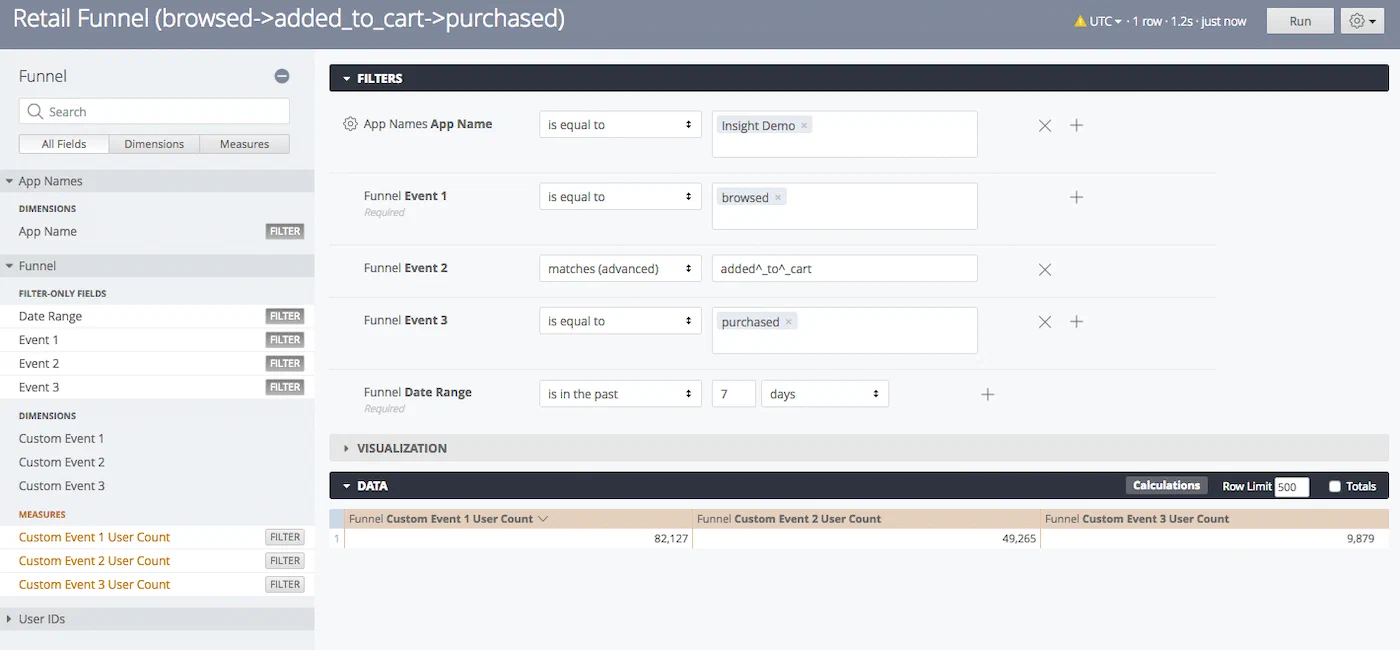
*Editing Funnel Explore filters*
> **Tip:** To remove the mapping of the event names from the Visualization, click the
> Visualization row's gear icon going to the gear icon, click Style in the
> top row, and delete the text in the *Series Labels* boxes:
> 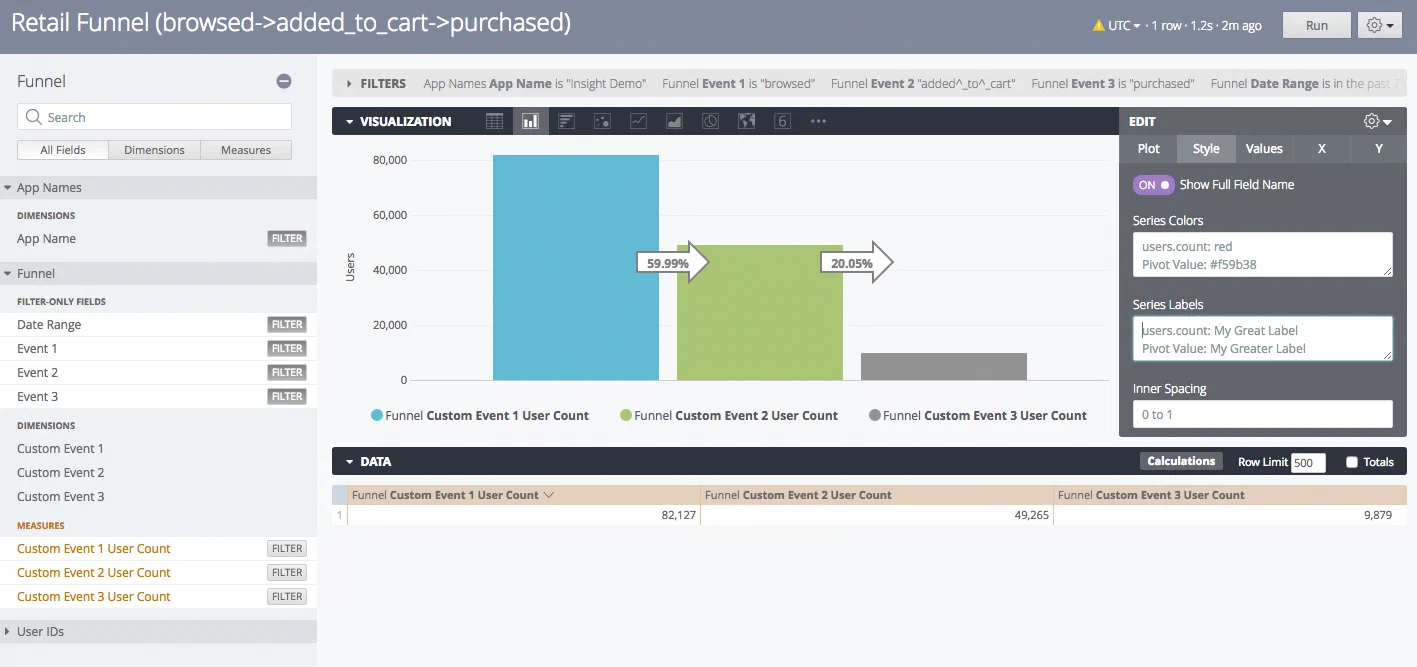
>
> *Removing Series Labels from the Visualization*
## See the Path of Users
To see the path of users, e.g., abandoned cart, follow these steps after
completing the steps in
[Show Goals Achieved Over a Time Range](#goals):
1. Make these changes in the left side menu:
* In *Funnel » Filter-only Fields*, click **Filter** next to *Event 2* and *Event 3* to remove the filters.
* In *Funnel » Dimensions*, click the rows for *Custom Event 1*, *2*, and *3* to add the dimensions.
1. Click **Run** and you will see the counts of users for each specific path:
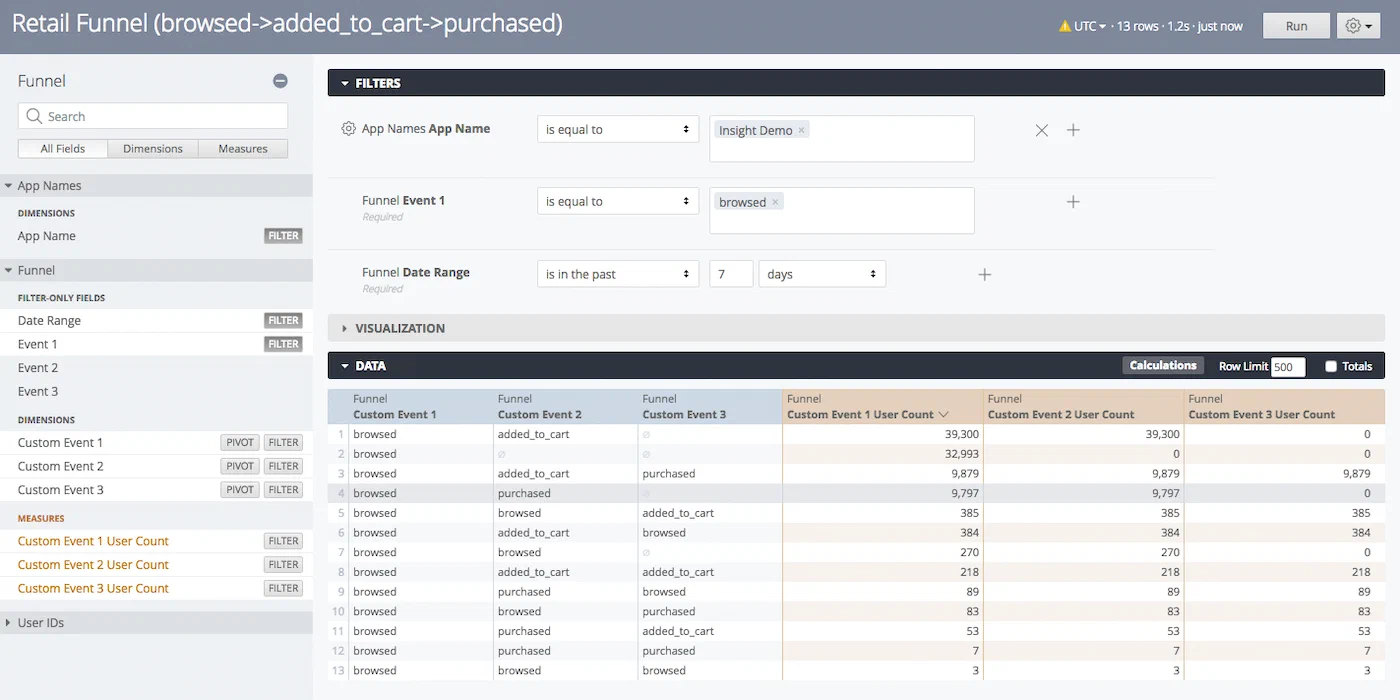
*Path query results showing user counts per event sequence*
# Set Up User-defined Properties
> Specify properties for Custom Events to provide more detail in the Revenue dashboard.
If you are using [Custom Event](https://www.airship.com/docs/reference/glossary/#custom_event) properties, you can further break down Revenue report results by property. Our SDKs contain [custom event templates](https://www.airship.com/docs/sdk-topics/custom-events/) that make sending properties easier to manage and analyze.
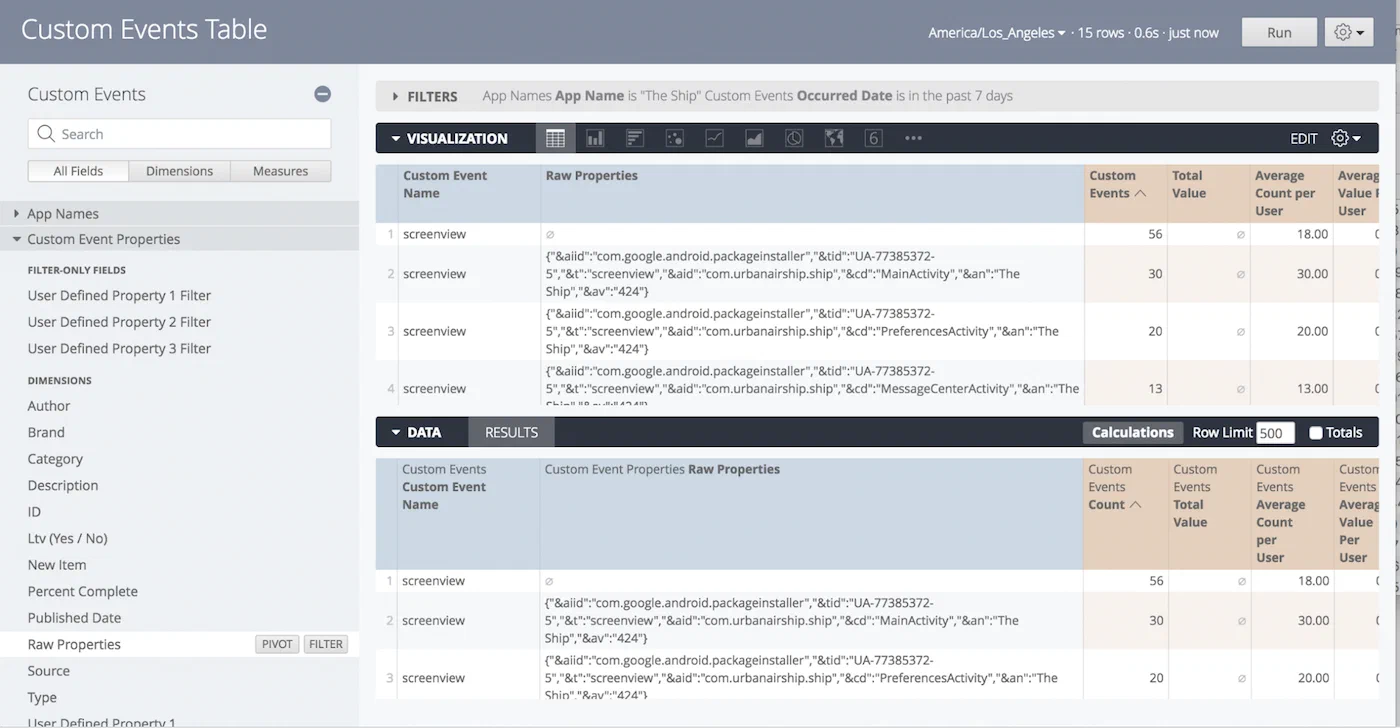
## Explore Custom Event Properties {#explore}
1. Go to *Reports » Performance Analytics*.
1. Select the *Revenue* dashboard.
1. For the *Custom Events Table* report, click the more menu icon (⋮) and select
*Explore From Here*. This table gives you a starting point for all the custom events that
happened during the specified time range. In the left side menu, in
*Custom Event Properties » Dimensions* you can see the properties used in
this tutorial:
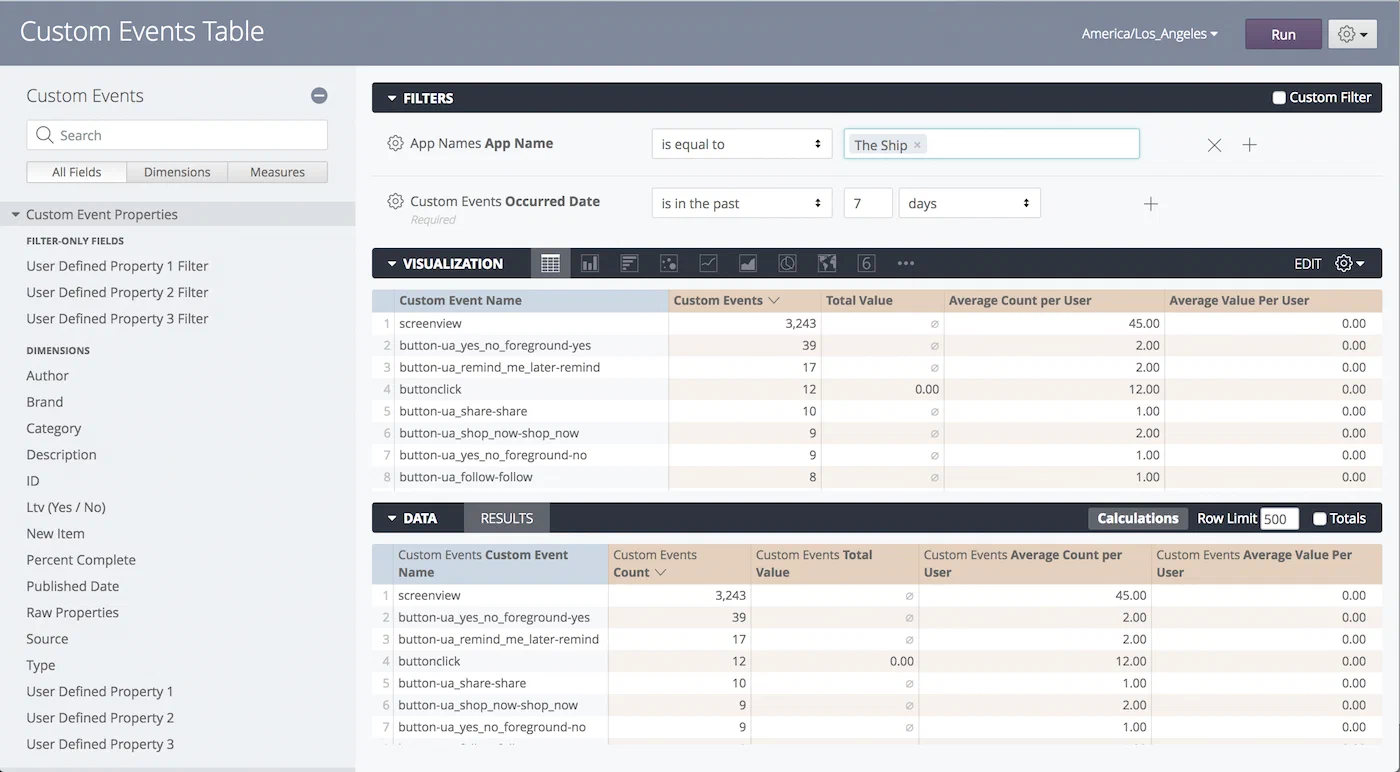
*Custom Event Properties dimensions and filters*
* Three *User-Defined Property* filters
* The *Raw Properties* dimension
* Three *User-Defined Property* dimensions
Once you know the keys for the properties you would like to expand on,
either select the templated name from the Custom Event Names in the
Visualization or Data results, or set up a user-defined property. The
remaining steps walk you through setting up a user-defined property. You
may specify up to three total.
## Set Up User-Defined Properties
After completing the steps in
[Explore Custom Event Properties](#explore):
1. Make these changes in the left side menu:
* In *Custom Event Properties » Filter-Only Fields*, click **Filter**
for *User-Defined Property 1 Filter*.
1. In *Filters*, set the *User-Defined Property 1 Filter* filter to `is
equal to` and enter the key as the value.
> **Tip:** If you don't know which key was used to send a custom event property,
> select the Raw Properties dimension. Locate the Customer Event
> Property in the Data results, then copy its corresponding key from
> the Raw Properties column.
> 
>
> *Copying a property key from Raw Properties*
1. Make these changes in the left side menu:
* In *Custom Event Properties » Dimensions*, click the row for
*User-Defined Property 1*. This displays the actual value for the
property that you specified in the User-Defined Property 1 filter,
adding the column to the Data table.
*Query results with the User-Defined Property column*
1. Click **Run**.
# Split Results By Tag
> Learn the process of splicing Performance Analytics results by tag.
Performance Analytics enable you to analyze attributes of specific user groups. If
you want to understand the attributes and behavior of your daily active users,
one rich source of data to leverage is user tags — which tags are most common
among daily active users?
This guide details the process of splicing Performance Analytics results by tag. You can
apply this pattern to many views.
1. Go to *Reports » Performance Analytics*.
1. Select the *Lifecycle* dashboard.
1. For the *Daily Active Users* report, click the more menu icon (⋮) and
select *Explore From Here*.
1. Make these changes in the left side menu:
* In *Tags Relative to Event » Dimensions*, click *Primary Device Tag* to add it to the Results table.
* In *Tags Relative to Event » Dimensions » Primary Device Tag*, click **Filter**.
1. In *Visualization*, select *Pie*.
1. In *Filters*, set the *Primary Device Tag* filter to `is
not null`. The view should now look something like this:
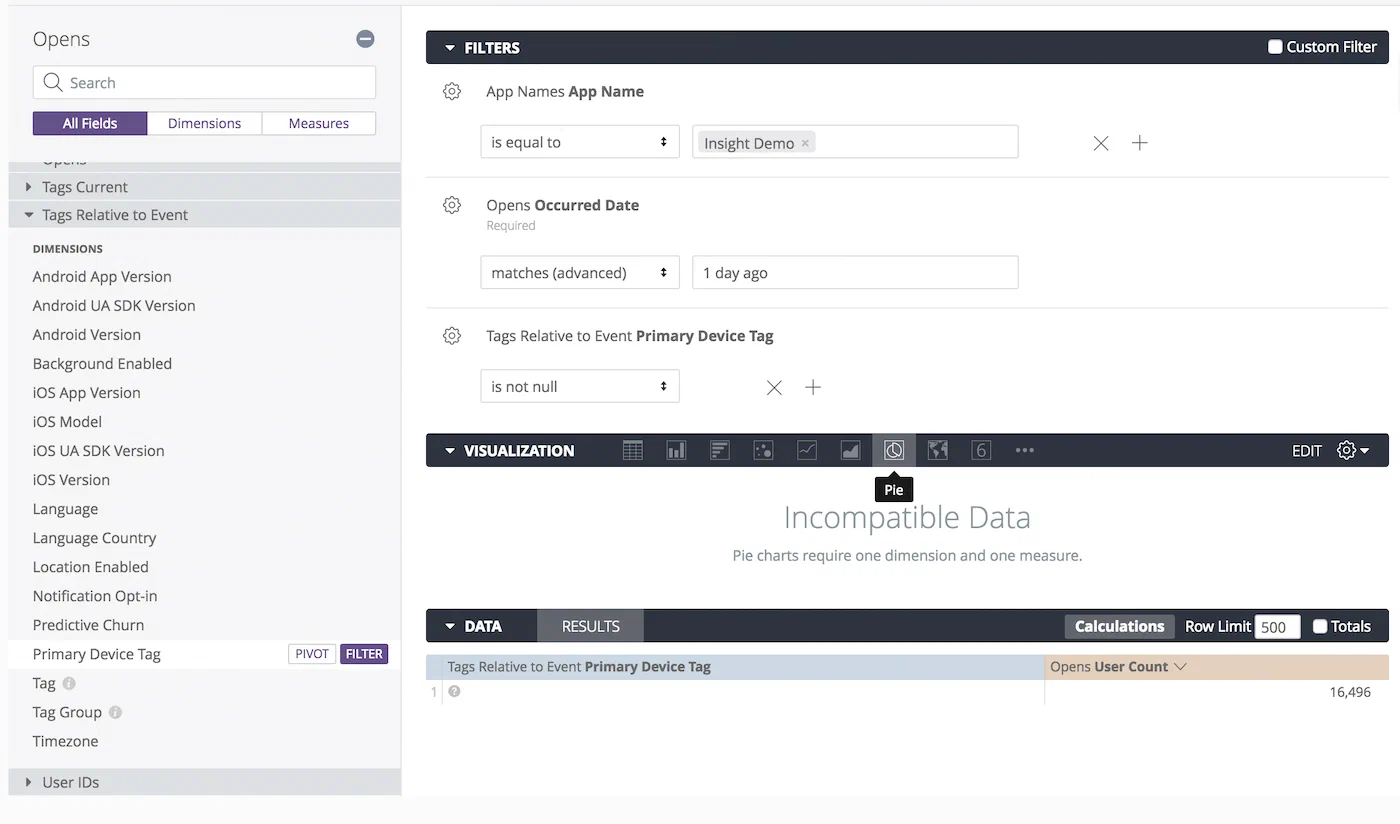
*Filtering by Primary Device Tag*
1. Click **Run**.
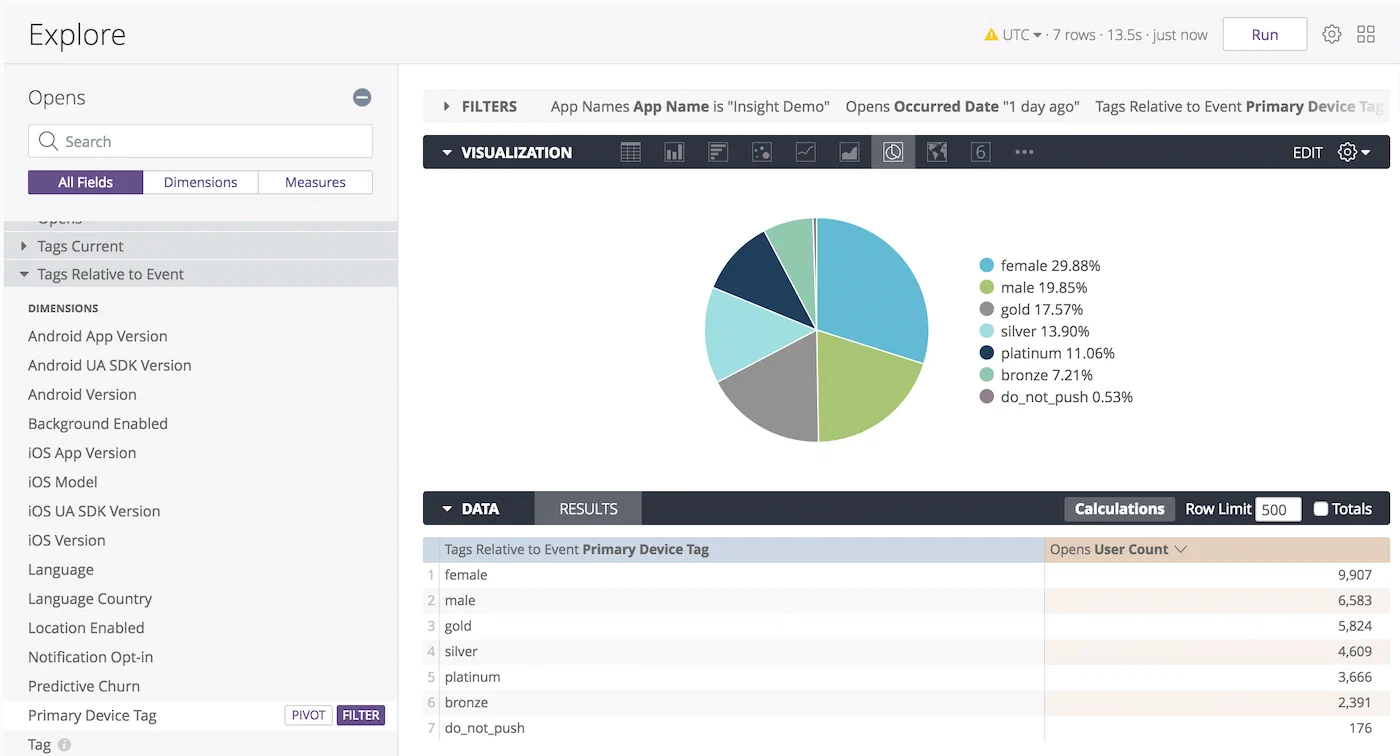
*Query results showing unique users by tag*
You now have a list of tags associated with the users that opened the app yesterday!
## Tag Split Analysis
Because a single user can have multiple tags set, the sum of values on the
right side of the table does not correspond to the total number of daily
active users, e.g., in the final image, a single user could have the
*likely-buyer*, *basketball* and *bourbon* tags. In this case, one user
accounts for three tags in the table. The total at the bottom right
corresponds to the number of users that opened the app *and* had a tag set. If
a user with no tags set opens your app, their action will not be included in
the total. Consequently, **the total may not match the number of daily active
users**.
## Additional Splicing Options
You can also filter by specific device property tags. For example, we can look
at the iOS SDK versions used by our daily active users. In Step 3 above,
rather than selecting *Primary Device Tag*, select *iOS UA SDK Version*.
We've predefined many of the important tag groups for you, but we also provide
general Tag Group and Tag dimensions if you're interested in other tags.
Setting Tag Group as a filter will generate a drop down list of possible
values. The Tag dimension contains the specific values within each possible
Tag Group. It is not necessary to filter out the null values when using the
combination of Tag Group and Tag dimensions.
You can see Tags at different time periods using Tag Current or Tag Relative
to Event. Tag Current is the current value, where Tag Relative to Event is a
user's tag at a certain event, such as an open or region event. Tags Current
and Tags Relative to Event function in the same manner.
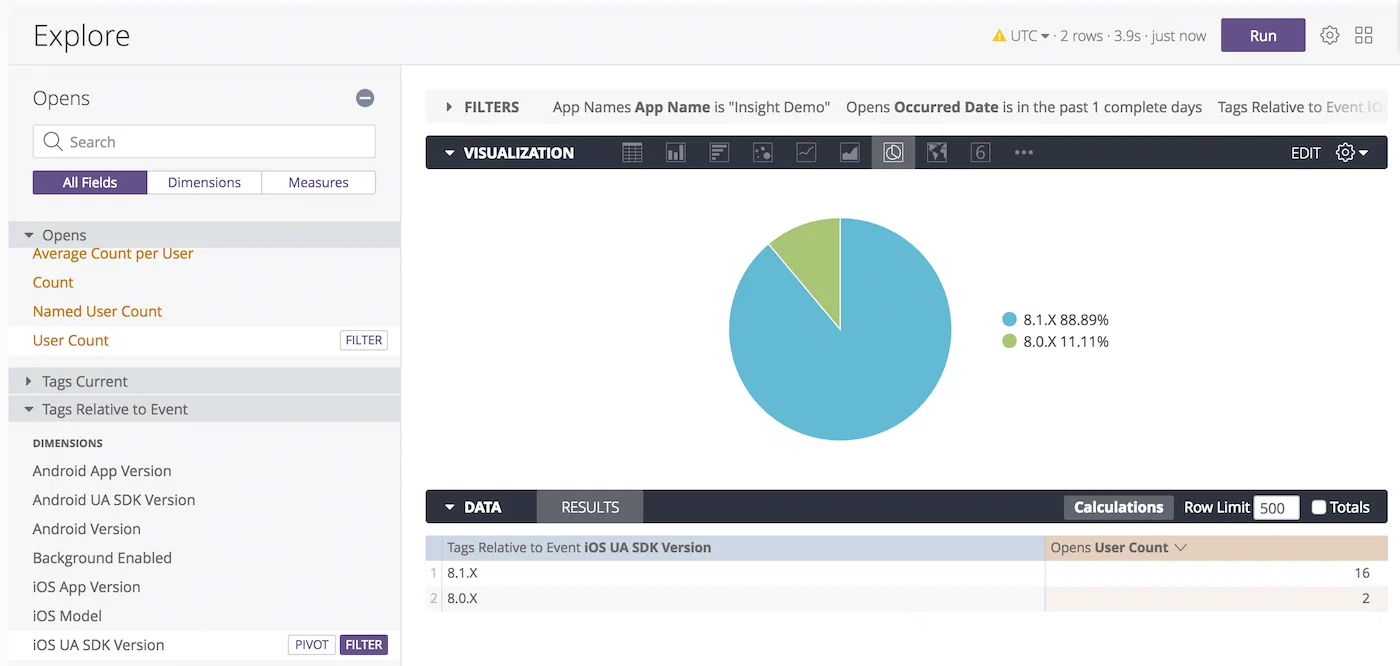
*Tags relative to event showing SDK version distribution*
We can see that most of our daily active users that use iOS are on SDK 8.1.x.