# Exploring Performance Analytics data
Learn how to create custom queries.
Looks are built using queries of the data in your project and displayed according to the visualization format set for the Look, such as Table, Timeline, or Single Value. This page explains how to view the queries behind the Looks and the ways you can explore your data.
## The Explore view
The base query of a Look is called an *Explore*. In any Look, hover and select the more menu icon (), then select **Explore from here**. This opens the Explore view, where you can see the selections, entries, and filters used to generate the information included in the query. From here, you can start customizing queries.
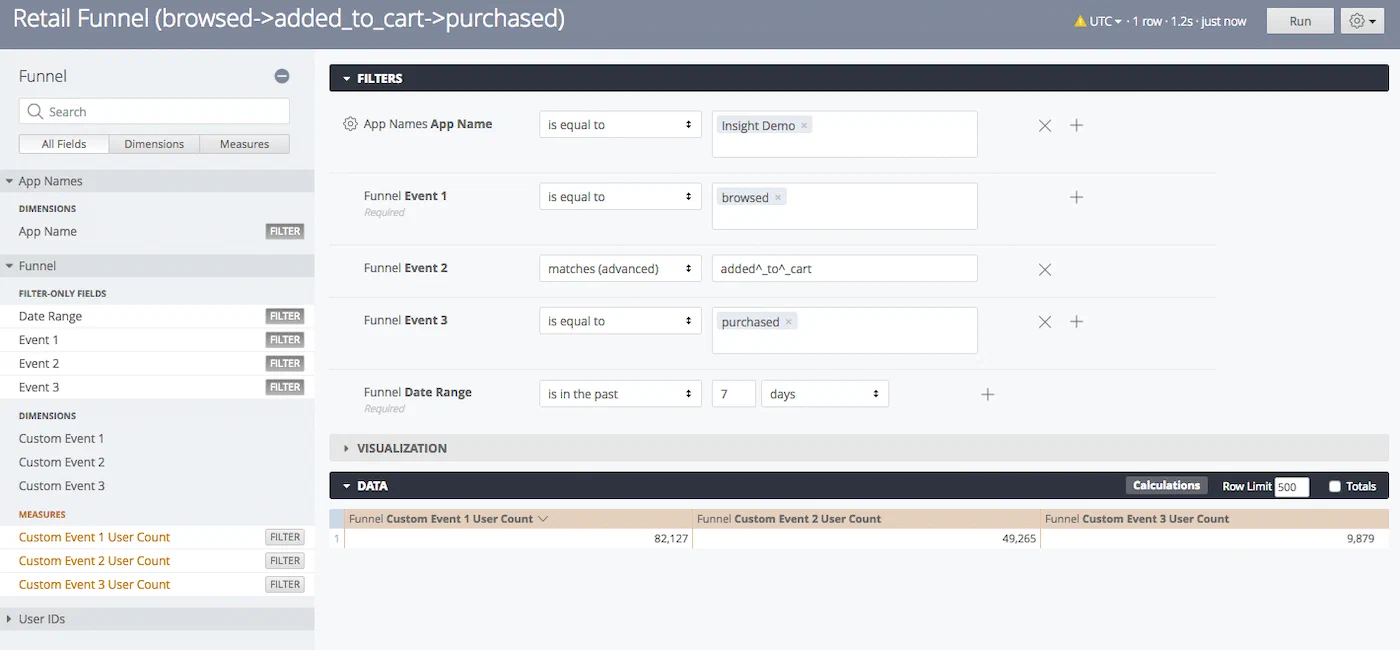
*The Explore view of the Funnel Look in the Revenue Dashboard*
Explore view sections:
| Section | Description and actions |
| --- | --- |
| **Sidebar** | At the top is the [Explore name](#explore-definitions), followed by a search field for filters, [Dimensions](https://www.airship.com/docs/reference/glossary/#pa_dimension), and [Measures](https://www.airship.com/docs/reference/glossary/#pa_measure) grouped in fields below it.Selections made here are immediately reflected in the Filters and Data sections. Separate tabs show All Fields and fields that are in use for the current query. |
| **Filters** | Use this section to configure the filters in the query.
You add filters by selecting the filter icon () for a Measure or Dimension in the sidebar. Select the add icon () or the remove icon () in a filter row to add or remove filters of the same type. Multiple filters of the same type are processed as a boolean OR.
The default value for the App Name filter is the current Airship project name. Operators and input support vary by field. For example a time dimension supports setting a time range, and text dimensions return matching values as you type.
To manually add filtering expressions, select the box for **Custom Filter** to expose the entry field.
Select **Run** after making changes. Only rows for which conditions are true will be returned in results. |
| **Visualization** | The Explore view opens to a default visualization format, one of Table, Column, Bar, Scatterplot, Line, Area, Pie, Map, Single Value, Static Map (Regions), Static Map (Points), Donut Multiples, or Single Record.
To view the data in another format, select an icon in the Visualization section header. Hover over an icon to see its label. You may need to select the more menu icon () to expose all options. Select **Edit** for options specific to the current format.
*The Visualization section header in the Explore view*Some Visualization types may be incompatible with the currently selected Dimensions and Measures. |
| **Data** | This section is essentially the Table visualization format. You can set the maximum number of rows to return and whether or not to display totals.
*The Data section header in the Explore view* See also [Saving Queries](https://www.airship.com/docs/guides/reports/analytics/tasks-queries/saving-queries/). |
{class="table-col-1-20"}
> **Tip:** You can bookmark queries in your web browser after opening the Explore view in a new window:
>
> * From a Look, hover and select the more menu icon (), then hold down **Ctrl** (Windows) or **Command ⌘** (Mac) on your keyboard and select **Explore from here**.
> * From the [Explore glossary](#predefined-explores), select the more menu icon () next to its name and select **Navigate to Explore**.
>
> Use your browser’s bookmark feature to save the view.
## Example data exploration
Let's find your app's in-app impression rate. To do this we need to
add two Measures to the Messages Look.
- Go to Reports, then Performance Analytics, and then select the Messages Dashboard.
- For the Messages Look, select the more menu icon (), and then select Explore from here.
- In the sidebar, select Message Metrics, then Measures, and then In-App Impression Metrics.
- Select the filter icon () next to:
- In-App Impression Rate
- In-App Dismissed User Rate
- Select Run.
For more tutorials, see our directory of [Common tasks and queries](https://www.airship.com/docs/guides/reports/analytics/tasks-queries/).
## Explore definitions
When exploring a Look, the top of the sidebar lists the name of the Explore used as its base query. There are two categories of Explores:
* **App** — These are limited to the data in your currently selected project. [*Go to app Explore descriptions below*](#app-explores)
* **Company** — These support aggregate metrics across multiple projects, for any projects you have access to. [*Go to company Explore descriptions below*](#company-explores)
### App Explores
Descriptions of [app Explores](#explore-definitions):
Active Users
: Count of the active users in your app.
Audience
: Devices that are not marked uninstall, and their active tags.
Audience by Tags
: Audience counts by combinations of tag group and tag value. Make sure to
leave default values in for unused filters.
Audience Opt In
: Metrics about your entire audience, split by opt-in
status. This includes any user that currently has an app installed or has
opted-in to web notifications.
Automation Message Report
: Aggregate performance of automated messages.
Correlated Uninstalls
: Messages and their uninstall rates.
Custom Event Cohort
: Daily open activity of users performing an activation event (custom event).
This helps you understand which goals keep a user retained for longer. See also
[Custom Events](https://www.airship.com/docs/guides/audience/events/custom-events/).
Custom Events
: User-level behavioral events. Understand how people are interacting with your
content. See also [Custom Events](https://www.airship.com/docs/guides/audience/events/custom-events/).
Experiments
: A/B Test push notifications.
Funnel
: Create a funnel or path based on user behaviors (custom events). See:
[Custom Events](https://www.airship.com/docs/guides/audience/events/custom-events/).
Growth by Day
: Counts by day of users installing, uninstalling, churning, and reactivating.
Typically run for a 7-day period.
In App Message Impressions
: Explore the number of users that have seen an In App Message over time.
Inactive Users
: Count of inactive users.
[Export lists of users](https://www.airship.com/docs/guides/reports/analytics/tasks-queries/export/)
that have been inactive to target on a different channel, such as email.
Lifespan
: Explore the lifecycle of your users from install to uninstall.
### Company Explores
Descriptions of [company Explores](#explore-definitions):
Audience
: Your current audience and their active tags.
Experiments
: A/B Test performance.
Opens
: Your app's open events.
Tag Events
: Tag adds and removals for users over time. Use this information to understand
which user properties are increasing or decreasing.
Tags Active by Week
: A count of users by active tags per week.
## Predefined Explores
In addition to being able to [see which Explore was used as the base query for a Look](#explore-definitions), Airship provides predefined Explores you can use to build custom queries. To access them:
1. Go to **Reports**, then **Performance Analytics**.
1. Select the folder icon (), then **Shared**.
1. Under **Looks**, select **Explore Glossary** (**Explore Glossary EUCS** for EU customers).
1. To open one in the Explore view, select its name and then **Navigate to Explore**.
The Explores available in the glossary are named for types of data queried, and they are limited to the data in your currently selected project:
| Explore | Data queried | Resource |
| --- | --- | --- |
| **Audience with Attributes** | Current user [Device Properties](https://www.airship.com/docs/reference/glossary/#device_properties), [Tags](https://www.airship.com/docs/reference/glossary/#tag), and [Attributes](https://www.airship.com/docs/reference/glossary/#attributes) (except JSON Attributes) | [Custom queries and reference for the Audience with Attributes Explore](https://www.airship.com/docs/guides/reports/analytics/exploring/audience-with-attributes/) |
| **Cohort Analysis** | Defines a cohort, cohort timelines (users who install per week), and a metric to track (retention by month) | Not yet published |
| **Custom Events** | [Custom Events](https://www.airship.com/docs/reference/glossary/#custom_event) | Custom queries and reference for the Custom Events Explore |
| **Device Events** | App sessions (Open events), Web sessions, installs, and uninstalls | [Custom queries and reference for the Device Events Explore](https://www.airship.com/docs/guides/reports/analytics/exploring/device-events/) |
| **Engagement** | Metrics for any and all channels | [Custom queries and reference for the Engagement Explore](https://www.airship.com/docs/guides/reports/analytics/exploring/engagement/) |
| **Scenes** | [Scenes](https://www.airship.com/docs/reference/glossary/#scene) | [Custom queries and reference for the Scene Explore](https://www.airship.com/docs/guides/reports/analytics/exploring/scenes/) |
| **Surveys** | [Surveys](https://www.airship.com/docs/reference/glossary/#survey) | Not yet published |
| **SMS Mobile Originated** | Mobile originated inbound SMS messages | Not yet published — See also [SMS in Performance Analytics](https://www.airship.com/docs/guides/reports/analytics/sms/) |
| **Tag Events** | Adding and removing [Tags](https://www.airship.com/docs/reference/glossary/#tag) to/from users | [Custom queries and reference for the Tag Events Explore](https://www.airship.com/docs/guides/reports/analytics/exploring/tag-events/) |
## Exploring region events
You can explore your project's region events using [Location Looks](https://www.airship.com/docs/guides/reports/analytics/definitions/#location). The following are definitions of the filters, Dimensions, and Measures used in Location Looks. You cannot explore this data using the User Locations heat map.
**Filter:**
> Recent Activity Hours
> : If not selected, this filter will default to 12 hours. If multiple numbers
are input, it will use the minimum number. If the filter is selected but no
number is input, it will use 1 hour.
**Measure:**
> Direct Open / Indirect Open / Send Count
> : The number of each event preceding the Arrival.
**Dimensions:**
> Dwell Indicator
> : Indicates whether an Arrival event has been matched to a Departure event. The events must be consecutive events for the same User in the same Region within 12 hours.
> Dwell Time Tier Hours
> : Buckets Dwells by hours. Tiers: 0, 1, 2, 3, 4, 5, 6. Dwells are placed into the intervals or six+ hours.
> Dwell Time in Min Tier
> : Buckets Dwells by minutes. Tiers: 0, 1, 5, 10, 30, 60. Dwells are placed into the intervals or 60+ minutes.
> Had Direct Open/Indirect Open/Send
> : For each Arrival event, we look back the number of selected hours (Recent Activity Hours) to see if that Arrival was preceded by the selected action.
> Unique Regions Encountered
> : The number of unique regions encountered by each user, Arrival or Departure.
> Unique Regions Encountered Tier
> : Buckets unique regions. Tiers: 0, 5, 10, 20, 40. Users are placed into the corresponding interval or 40+ Regions.