Audience Pulse
Audience Pulse analyzes user activity using the Recency, Frequency, Monetary (RFM) method. You can create Segments from selected tiers and transitions within the reports and use them to target specific users.
See the Audience Pulse feature guide for how RFM analysis, tiers, reports, and segments work.
Add models and generate tiers
Add up to three models for your project:
- Go to Audience, then Audience Pulse.
- Select Add model, or Generate Audience Pulse if you have no models yet.
- Enter a name for the model so you can distinguish it from others.
- Select events to measure for recency, frequency, and monetary value. Select any custom eventA record of an action in your app, on your website, in the Airship system, or in an external system. Examples are a message send, an app open, or a purchase transaction. in your project or a default event:
- App:
app_openormessage_center_read - Web:
web_clickorweb_session - Email:
email_click,email_open,email_unsubscribe, oremail_bounce - SMS:
short_link_click
- App:
- For the Monetary event, select an event property for the time or monetary amount the user spent on the event, such as the property named Time in app. The menu includes all properties with numeric or
ANYvalues. - For Analysis window, select a time period that matches your user lifecycle. Only users with at least one event occurrence during that window are included in the analysis.
- Select Start. Analysis and tier generation will begin.
The processing time for generating the tiers can vary depending on the size of your audience and the analysis window. You can leave the page during this process.
After you start analysis, your models appear in the Audience Pulse list. Use the more menu icon () for a model to edit the name or remove it from your project. Removal does not affect your remaining models.
Access reports and create segments
In your list of models, select a model name to open the Distribution and Transitions reports.
At first, each report looks back over the analysis window from the current date and again from one week prior. For example, with a 30-day window, you see the past 30 days through today and the past 30 days ending seven days ago. Analysis regenerates weekly.
If analysis has not yet completed, In progress appears in the date range column. After selecting the model name, the only available action is Stop, which will stop analysis and remove the model from your project.
Distribution
The Distribution report shows the relative size of each tier, plus user count and audience percentage. Hover over a tier to see its description, median monetary value, and monetary event property.
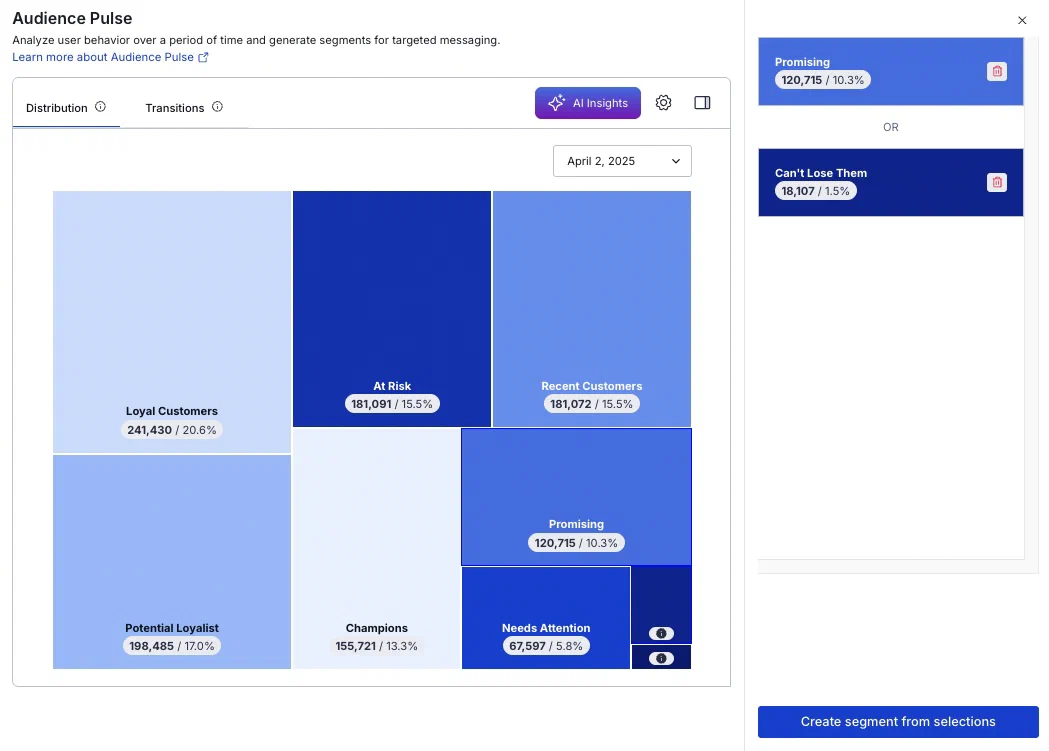
Create a segment from tiers:
- Select one or more tiers, and they will appear in a list in the sidebar. To remove a tier from the list, select the remove icon () or select it again in the report. Multiple tiers are handled as a Boolean OR. Select the sidebar icon () to collapse or expand the sidebar.
- Select Create segment from selections.
- Enter a segment name.
- (Optional) Enter a description.
- (Optional) Disable Update weekly to save the segment with the current values only. You cannot change this behavior later.
- Select Save segment.
Transitions
The Transitions report shows the tiers in columns for two selected weeks, and each tier’s user count and audience percentage. Connecting lines indicate the movement of users between tiers from one week to the next. Hover over a tier to see its description, median monetary value, and monetary event property.
High volume transitions are highlighted. These are the top 30% of transitions by number of users who moved between tiers. Uncheck Show important transitions to remove highlighting.
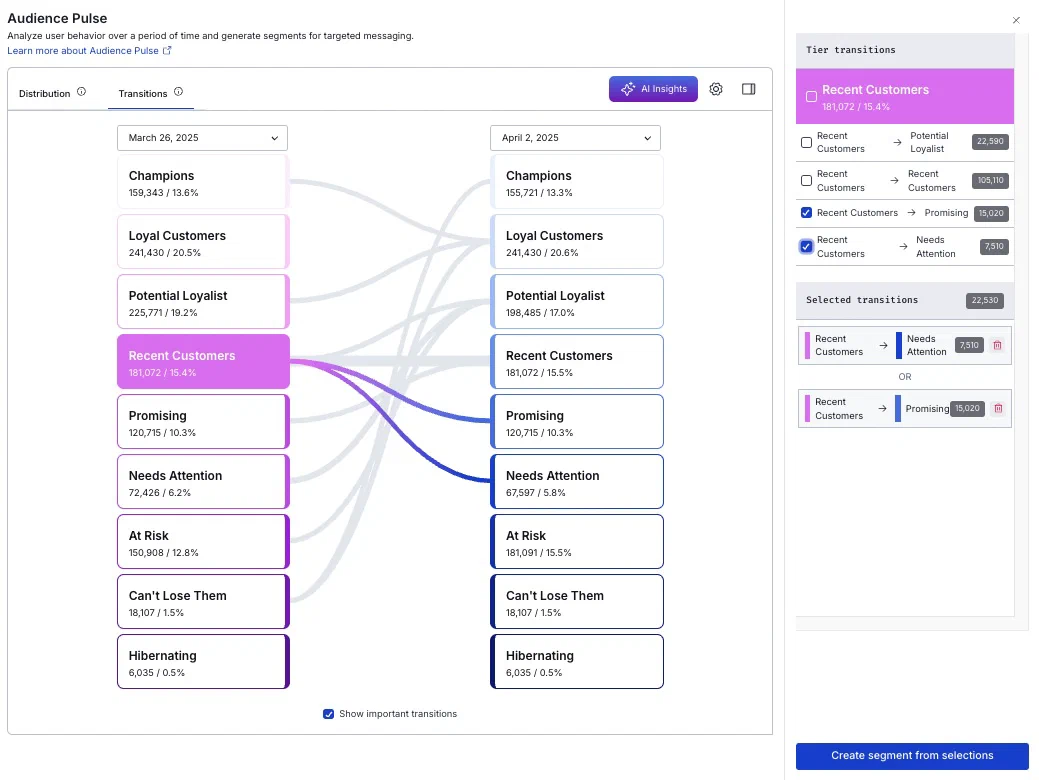
Select new dates to update the displayed transitions. Select a tier in either column, and all transitions into and out of that tier will be listed in the sidebar, with the number of users in each transition group.
Create a segment from users who transitioned between tiers for your selected dates:
- Select tiers to add them to the sidebar list.
- Select the tier name in the sidebar to include all transition groups or select individual groups. Repeat for additional tiers. Multiple transitions are handled as a Boolean OR. Select the sidebar icon () to collapse or expand the sidebar.
- Select Create segment from selections.
- Enter a segment name.
- (Optional) Enter a description.
- (Optional) Disable Update weekly to save the segment with the current values only. You cannot change this behavior later.
- Select Save segment.
Manage segments
Go to Audience, then Segments to view and manage your Audience Pulse segments. See Managing segments.
AI recommendations
For AXP Enterprise plans, apply AI analysis for deeper insights into audience activities and get actionable recommendations to build more effective, targeted campaigns. Recommendations use tier median monetary value from your models to surface insights. You can also generate a CampaignA container for organizing and coordinating related messages across channels. They provide message list and calendar views to monitor status, spot scheduling gaps, and avoid overlap. for any recommendation.
To access your recommendations in Audience Pulse, select AI Insights. A drawer expands and displays summary cards for five recommendations. Select a card to see the details:
- Why this matters describes the discovered trend and the importance of addressing it.
- Recommendations provides the recommended course of action and implementation instructions. Recommendations can include messages, experiences, JourneysA continuous user experience of connected Sequences, Scenes, and/or In-App Automations., and experiments.
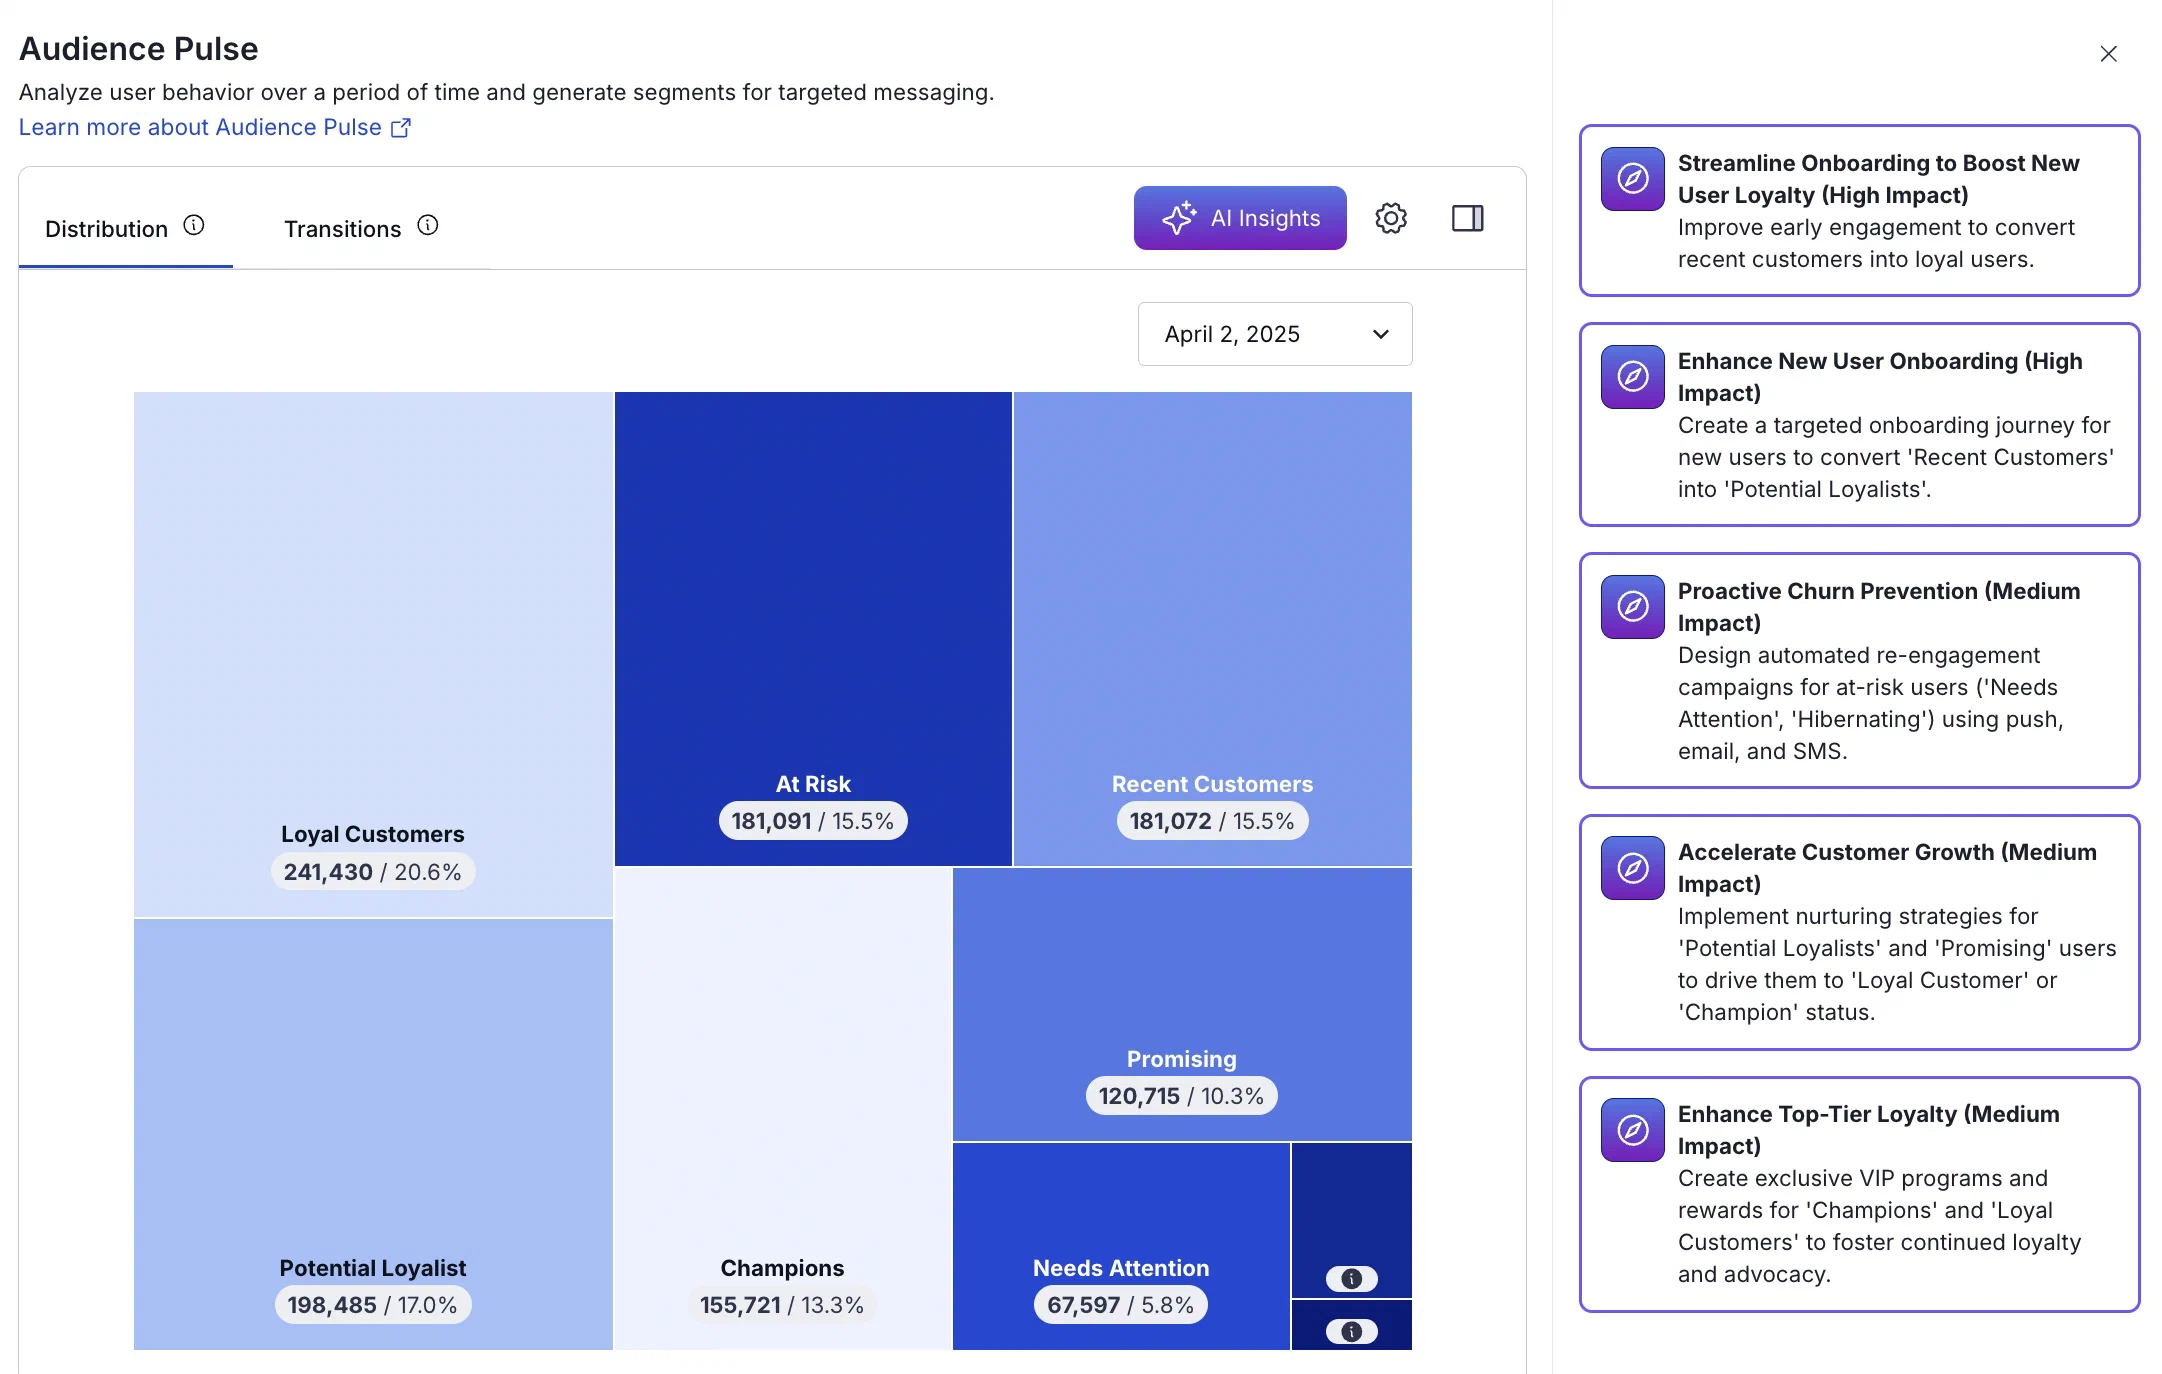
Select Generate Campaign for any recommendation, and a new browser tab opens to an untitled Campaign with a new Campaigns AI Agent chat showing the recommendation and an implementation summary. The agent uses the recommendation’s audience and messaging suggestions to draft messages and asks clarifying questions as needed. As with any other message, review and refine your content before sending. See Create and refine Campaigns using AI in Campaigns.
For even more relevant recommendations, add your brand’s homepage URL for analysis. The homepage text provides context to ensure insights are a better fit for your brand. Select the dropdown menu () next to your project name, then Project details, and update the Website URL. The industry setting for your project is also taken into account. The current values for both are processed each time AI recommendations are run.
Opting In to AI Functions
If you opted out of AI usage, you must sign an updated contract to enable this feature. Contact your account manager for assistance.
Compliance Considerations in Using AI Functions
The Service incorporates AI functions, including Generative AI and Agentic AI.
Generative AI generates content such as Notification copy, images, and Journeys based on your prompts.
Agentic AI autonomously optimizes, personalizes, or executes cross-channel customer engagement actions, or analyzes audience and performance data, subject to the parameters and controls you set in the Service. These systems operate under human-defined parameters and do not initiate customer-facing actions without human interaction or pre-configured parameters. You are responsible for reviewing Generated Outputs for accuracy, appropriateness, and to ensure they do not violate third-party intellectual property or other rights. Airship does not publish Generated Outputs to end users without approval from the Customer.
In addition to the applicable terms of your agreement with Airship (e.g., Use of Service, Customer Responsibilities sections), you must comply with the Airship Acceptable Use Policy, which provides additional details about appropriate conduct when using the Service.
The Service includes safety features to block harmful content, such as content that violates our Acceptable Use Policy. You may not attempt to bypass these protective measures or use content that violates your agreement with Airship.
About the AI models:
Airship utilizes Google Gemini and Imagen to generate copy and images for AI Scene screens. The content is created solely with Google’s out-of-the-box models, and no customization or fine-tuning with Customer Data is applied. See Responsible AI in Google’s Google Cloud documentation.
Analysis, tiers, and tagging
For each Recency, Frequency, and Monetary category, users are divided into groups: top, middle, and bottom thirds. The groups are in relation to all the other users in the category. Here are a few examples to illustrate:
- A user who visited the app the most recently will fall into the top third of the Recency category, because they are in the top 33% of recent visitors. A user who opened the app the furthest back in time in the analysis window will be in the bottom third.
- Users who opened the app more times than the bottom two thirds of the audience will fall into the top third of the Frequency category. Users who opened the app fewer times than the top two thirds of the audience will land in the bottom third.
- A user who spent the most time in the app will fall into the top third of the Monetary category. A user who spent the least time in the app will land in the bottom third.
Each third has a value: 3 for top, 2 for middle, and 1 for bottom. Each user is represented by a combination of these distributed values. For example:
- A user at the top third for Recency, middle for Frequency, and top for Monetary is represented as 323.
- A user at the top third for Recency, bottom for Frequency, and middle for Monetary is represented as 312.
Users are assigned a tier based on their distribution.
This table lists each tier, its description, and the Recency, Frequency, and Monetary distributions that map to it:
| Tier | Description | Distributions |
|---|---|---|
| Champions | Users who performed the analyzed event most recently, most often, and spent the most on it | 333 |
| Loyal Customers | Users who performed the analyzed event recently, often, and spent a great amount on it | 332, 233 |
| Potential Loyalists | Recent users who spent a good amount on the event | 223, 323, 322, 232 |
| Recent Customers | Users who visited most recently but haven’t yet moved into the Potential Loyalists tier and could easily go down in ranking | 311, 313, 312, 331, 321 |
| Promising | Users with average Recency scores and potential to increase Frequency or Monetary scores | 222, 221, 212, 213, 231 |
| Need Attention | Users who haven’t performed the analyzed event in a while or have low Frequency and Monetary scores and whose Recency is fading | 123, 113, 211 |
| At Risk | Users with above average Frequency but who haven’t performed the analyzed event for a long time, so are strong candidates to re-engage | 122, 132, 131 |
| Can’t Lose Them | Users who have spent a great amount and performed the analyzed event often but not recently | 133 |
| Hibernating | Users whose last visit was a while ago, have infrequent visits, and have not spent much | 111, 112, 121 |
When assigned a tier, tagsMetadata that you can associate with a channel or named user for audience segmentation. Generally, a tag is a descriptive term indicating a user preference or other categorization, such as wine_enthusiast or weather_alerts_los_angeles. describing the tier and analysis window date are assigned to users. Tags are added at the contact level.